Tamadoge (TAMA/USD): Charting the Course for a Potential Rebound
Estimated Reading Time: 3 minutes
Don’t invest unless you’re prepared to lose all the money you invest. This is a high-risk investment and you are unlikely to be protected if something goes wrong. Take 2 minutes to learn more
Following a brief bullish surge that reached a lower high above the $0.010 price level, the TAMA/USD market has transitioned into a gradual and persistent bearish trend. Despite attempts to find support at levels around $0.006 and $0.0055, the market has struggled to stem the downward momentum at around the $0.0045 price level. This could potentially be attributed to the historical significance of the $0.0045 price level in previous market sessions, particularly evident in February. Notably, this price level is attracting interest from new investors seeking significant returns on their investments.
Key Levels
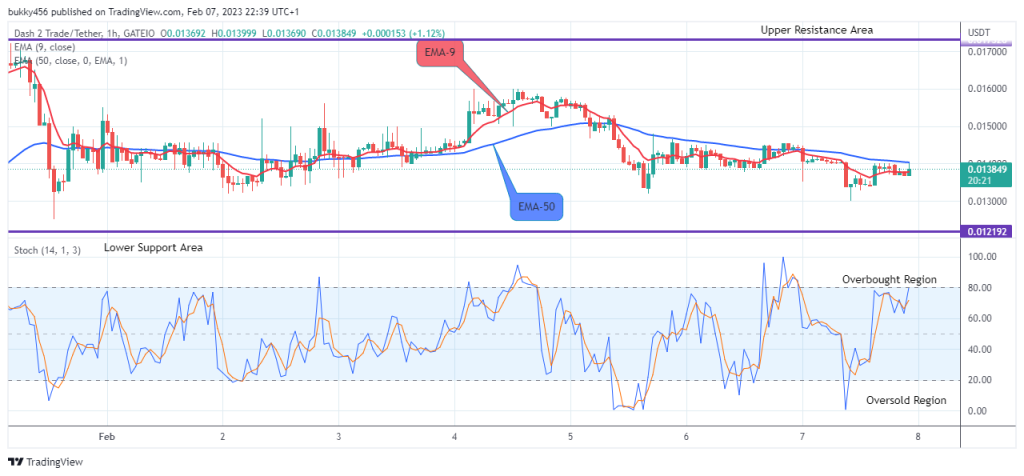
- Resistance: $0.013, $0.014, and $0.015.
- Support: $0.0045, $0.0040, and $0.0035.
TAMA/USD Price Analysis: The Indicators’ Point of View
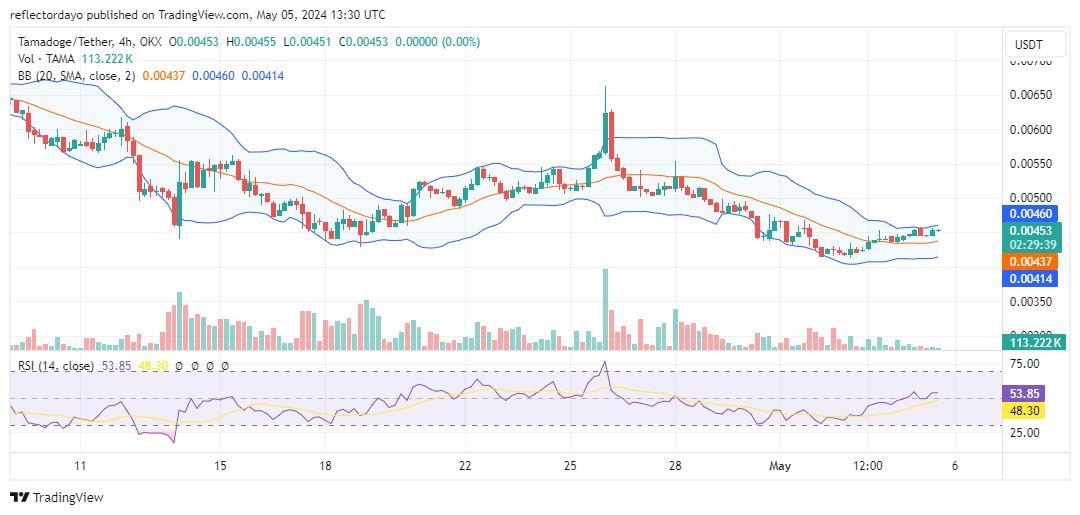
Analysis of the chart indicates a reduction in bearish momentum as the market approaches the $0.0045 price level. As a result of this crypto signal, bullish activity appears to be emerging around this level, suggesting a potential shift in market sentiment towards the upside. Presently, the price action has risen above the 20-day moving average, indicating a positive trend. However, it’s worth noting that the Bollinger Bands are currently exhibiting a narrow range around the $0.0045 price level, signaling decreased volatility. This often serves as a precursor to a price rebound. With the market poised in bullish territory, a slight increase in volatility could catalyze further upward movement.
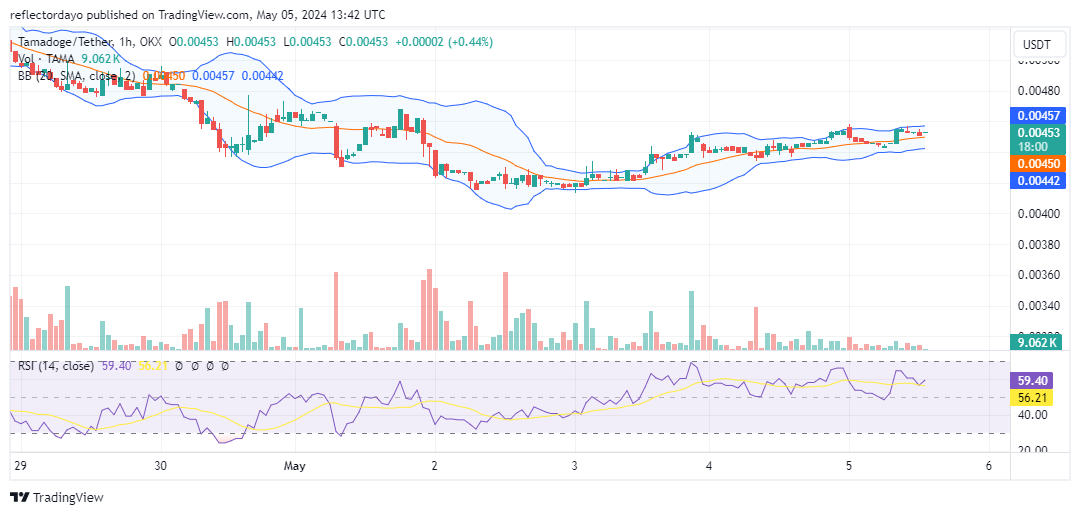
Tamadoge Short-Term Outlook: 1-Hour Chart
Upon examining the 1-hour chart, a subtle yet discernible upward trajectory in the market becomes apparent. Following the recent bearish phase, which saw a low point near the $0.00419 price level, the market has exhibited a consistent upward movement. Presently, the price appears to have solidified its position above the $0.0045 threshold. However, as the TAMA/USD price approaches the $0.0046 level, there is a notable emergence of bearish sentiment. Nevertheless, there remains optimism that the market may successfully breach this level, particularly targeting the $0.00461 price threshold.
Explore a selection of 5 intense games with the most beloved doge characters. Get past obstacles, figure out puzzles, or sprint to the finish! $TAMA
🎮 End Your Weekend in the #Tamadoge Arcade! 🕹️🌟
Dive into a collection of 5 action-packed games featuring everyone’s favorite doge characters. Dodge obstacles, solve puzzles, or race to the finish line! $TAMA
📱 Android: https://t.co/3PXpfUAM0J
📱 iOS: https://t.co/UN5MlRGh44 pic.twitter.com/ZSYJ8gDTrs— TAMADOGE (@Tamadogecoin) May 5, 2024
Do you want a coin that will be 100 times more valuable in the next few months? That is Tamadoge. Buy TAMA today!