Tamadoge (TAMA/USD) Gains Momentum from $0.00564 Support, Anticipates Strong Bullish Momentum
Estimated Reading Time: 3 minutes
Don’t invest unless you’re prepared to lose all the money you invest. This is a high-risk investment and you are unlikely to be protected if something goes wrong. Take 2 minutes to learn more
The TAMA/USD market encountered rejection twice at the $0.00659 price level, as observed on the daily chart. This validates the $0.00659 resistance level as significant. However, recent trading activities indicate a struggle for market dominance around $0.00565, coinciding with the 20-day moving average. Today’s trading activity, characterized by a plus sign doji at the end of the downtrend, suggests a potential movement in a soon-bullish direction for the market.
Key Levels
- Resistance: $0.013, $0.014, and $0.015.
- Support: $0.0045, $0.0040, and $0.0035.
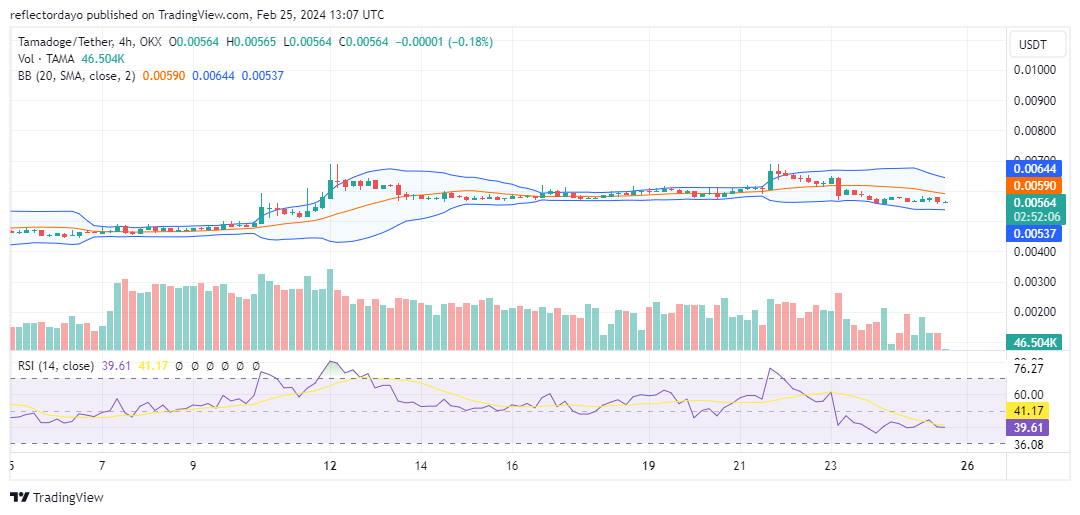
TAMA/USD Price Analysis: The Indicators’ Point of View
Considering historical market performance, making a positive decision, indicating optimism, to go long in the TAMA/USD market is reasonable. The $0.00565 support level has historically proven resilient against bearish pressure, as evidenced by a series of flat dojis appearing at the end of downward trends. While there are currently no clear indications of an imminent price surge, traders should remain vigilant for signs of a potential uptrend.
One such sign could be the appearance of a minus sign doji, particularly if it occurs at the end of the trend. However, investors should exercise patience and await further confirmation of a crypto signal pointing to an impending bullish move. Additional confirmatory signals are likely to emerge, potentially signaling an imminent price surge in the near future.
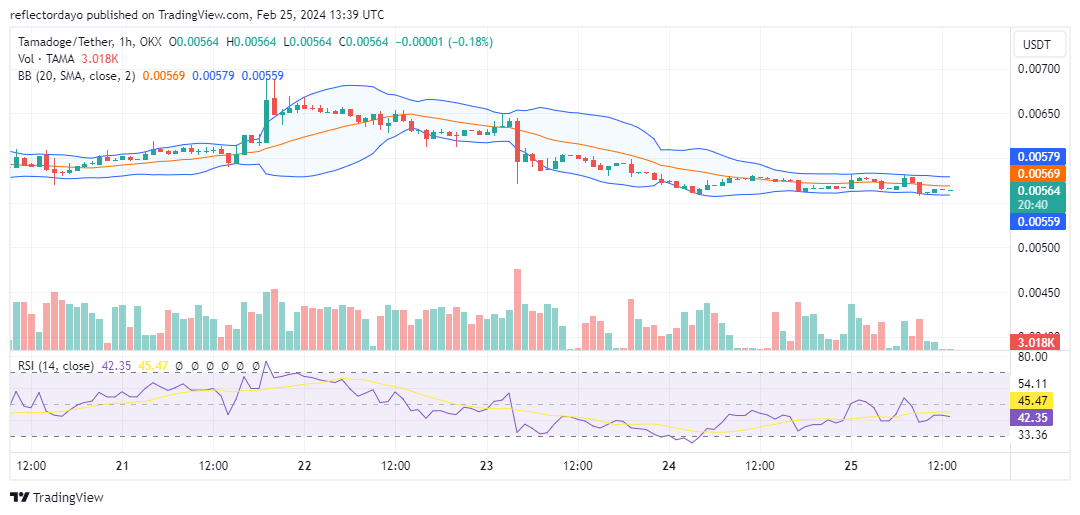
Tamadoge Short-Term Outlook: 1-Hour Chart
Upon examination of the 1-hour chart, there are compelling indications suggesting an imminent bullish price movement. A close observation within the narrow price range reveals significant price fluctuations, yet these movements did not impact the Bollinger Bands. This observation raises the possibility of institutional activity, possibly involving the accumulation of positions. Institutions may be strategically acquiring positions at specific price levels, either in preparation for further price movement or for distribution to retail traders.
Buy TAMA/USD!
The Tamaverse is now on @0xPolygon
💎 Low gas fees to claim $TAMA prizes
💎 Low gas fees to level up your NFTs
💎 Low gas fees to stake your earningsPlay and earn more on Tamadoge Arena now 👇
📱 Android: https://t.co/INCaGendE4
📱 iOS: https://t.co/Fj9tT5Oicu pic.twitter.com/hUw4FX4sag— TAMADOGE (@Tamadogecoin) February 9, 2024
Do you want a coin that will be 100 times more valuable in the next few months? That is Tamadoge. Buy TAMA today!