Tamadoge (TAMA/USD) on the Move: Price Eyes $0.012 Despite Bearish Headwinds
Estimated Reading Time: 2 minutes
Don’t invest unless you’re prepared to lose all the money you invest. This is a high-risk investment and you are unlikely to be protected if something goes wrong. Take 2 minutes to learn more
TAMA/USD Bulls are asserting dominance around the $0.007 price level, having engineered a breakout from the previous trading stalemate. This level emerged as a significant support zone, weathering the recent bear market that followed the prior peak of $0.012. Repeated price rejections at $0.007 bolstered this support, eventually exhausting bearish sentiment and triggering a notable price increase.
Key Levels
- Resistance: $0.013, $0.014, and $0.015.
- Support: $0.0045, $0.0040, and $0.0035.
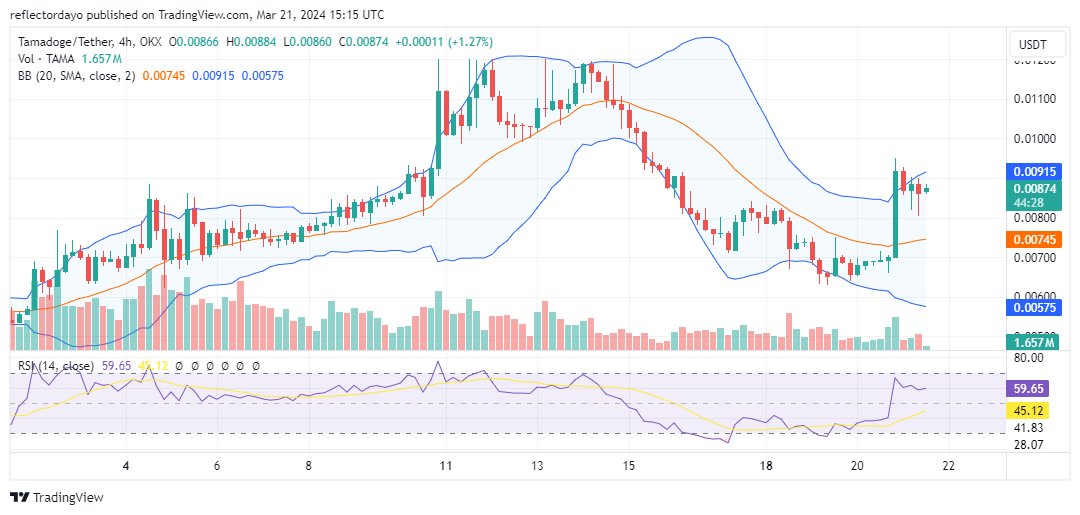
TAMA/USD Price Analysis: The Indicators’ Point of View
A strong bullish session on March 20th propelled the market above the previous resistance at $0.007. The rally encountered some expected resistance at $0.009, a level that previously acted as a hurdle during the prior bull run. However, this resistance was then overcome with relative ease. TAMA/USD Bulls may retain control despite the current price consolidation around $0.00867, which remains close to the key resistance level of $0.009. The Relative Strength Index (RSI) reinforces this notion, as it currently sits at 59, indicating ongoing bullish momentum.
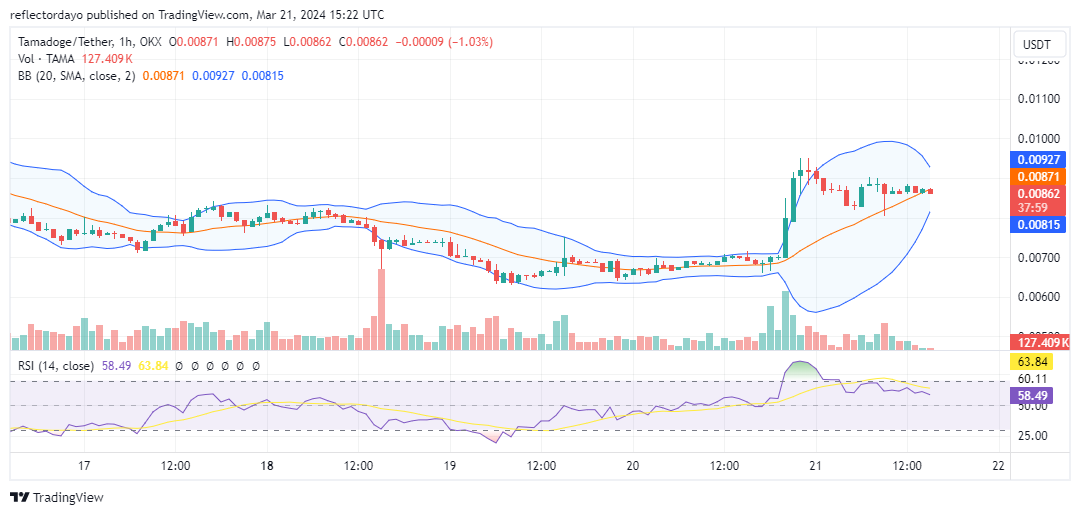
Tamadoge Short-Term Outlook: 1-Hour Chart
Based on the analysis of the one-hour chart, the Relative Strength Index (RSI) indicates a corrective movement of prices that occurred in previous sessions, pulling back from the overbought region. The RSI has stabilized consistently around 61 over several sessions. While this crypto signal suggests a possible extension of the consolidation phase, indications from the Bollinger Band indicator suggest a forthcoming definitive market direction. There is anticipation for a continuation of the bullish trend.
Buy TAMA/USD!
Dive into the fun of our free-to-play Tamagotchi-style app where you can earn $TAMA by caring for your own adorable pet!
Download Tamadogi on Android & iOS now to start earning 👇
📱 Android: https://t.co/RfZIZOLaNJ
📱 iOS: https://t.co/du3iReizS4 pic.twitter.com/gFxppuh3sI— TAMADOGE (@Tamadogecoin) February 29, 2024
Do you want a coin that will be 100 times more valuable in the next few months? That is Tamadoge. Buy TAMA today!