Tamadoge (TAMA/USD) Poised to Break Through $0.0085 Resistance
Estimated Reading Time: 3 minutes
Don’t invest unless you’re prepared to lose all the money you invest. This is a high-risk investment and you are unlikely to be protected if something goes wrong. Take 2 minutes to learn more
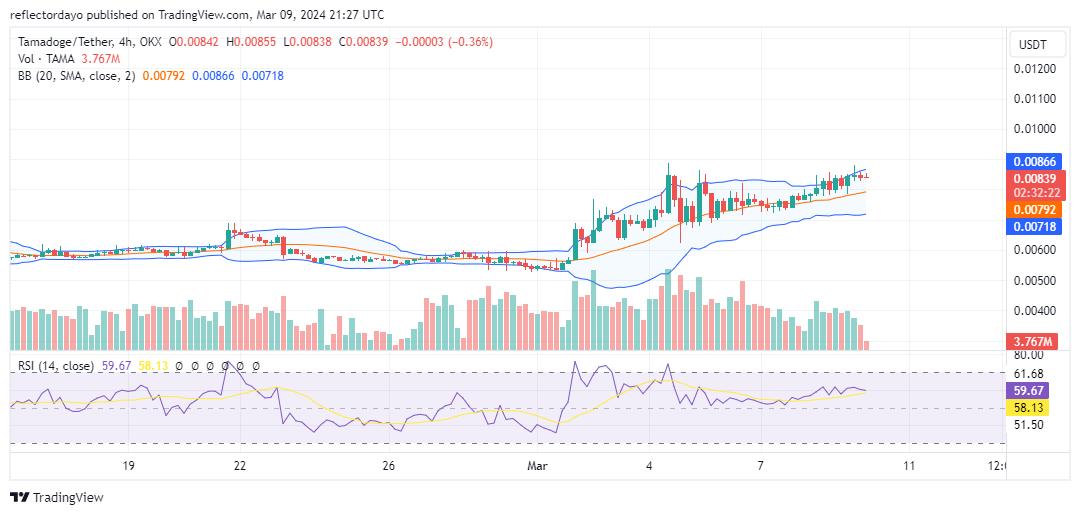
The TAMA/USD market has rallied back to the $0.0085 resistance level, the point where bears emerged in March and triggered a price decline. This downward move was halted by bullish intervention around $0.007.
Since March 5th, a tug-of-war between bulls and bears has been playing out. The Bulls have gained some control by strategically securing a series of slightly higher support levels. Currently, the $0.008 level acts as support, allowing bulls to pressure the key resistance at $0.0085.
However, price action has stagnated at the resistance level, indicating a stalemate between buying and selling pressure.
Key Levels
- Resistance: $0.013, $0.014, and $0.015.
- Support: $0.0045, $0.0040, and $0.0035.
TAMA/USD Price Analysis: The Indicators’ Point of View
The recent emergence of doji candlesticks at the resistance level could be misinterpreted as a bearish reversal crypto signal. However, these patterns may not necessarily translate into a significant downtrend.
A decisive breakout above the critical $0.0085 resistance level could attract further bullish participation and propel the price higher. Conversely, a failure to breach this level may lead to a test of the $0.008 support zone.
The Relative Strength Index (RSI), currently hovering around 60, suggests a state of equilibrium between buying and selling pressure. While the bulls maintain control as the RSI remains above 50, a sustained move below this level could indicate a shift in momentum towards the bears.
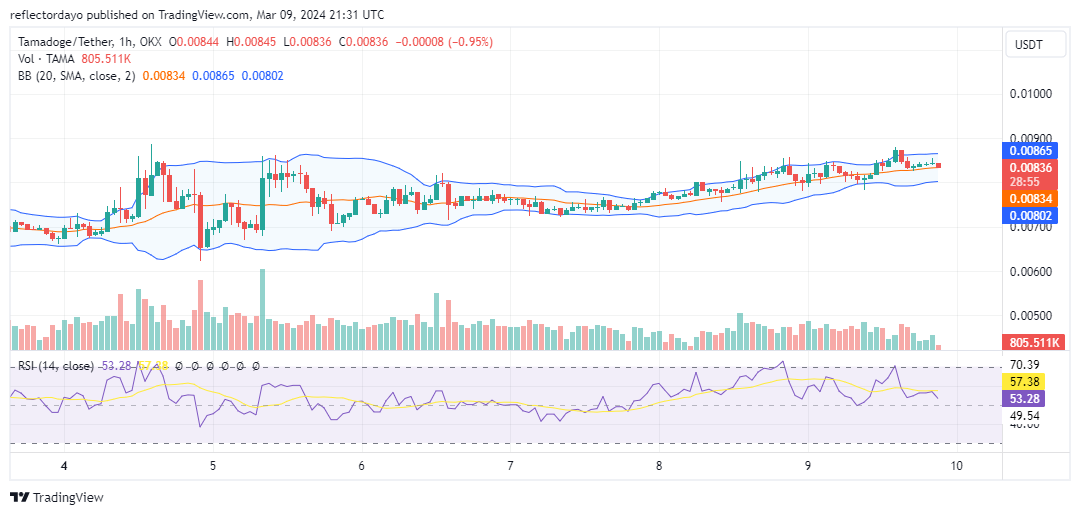
Tamadoge Short-Term Outlook: 1-Hour Chart
Mirroring the 4-hour timeframe, the Relative Strength Index (RSI) on the 1-hour chart also presents a positive outlook, albeit with a slightly weaker reading of 54. This value sits close to the equilibrium level, suggesting a potential consolidation phase if the market fails to overcome the current resistance. A break above resistance could lead to renewed upward momentum, while a break below could trigger a test of the support level.
Buy TAMA/USD!
Dive into the fun of our free-to-play Tamagotchi-style app where you can earn $TAMA by caring for your own adorable pet!
Download Tamadogi on Android & iOS now to start earning 👇
📱 Android: https://t.co/RfZIZOLaNJ
📱 iOS: https://t.co/du3iReizS4 pic.twitter.com/gFxppuh3sI— TAMADOGE (@Tamadogecoin) February 29, 2024
Do you want a coin that will be 100 times more valuable in the next few months? That is Tamadoge. Buy TAMA today!