Tamadoge (TAMA/USD) Price Skyrockets as Bullish Momentum Strengthens
Estimated Reading Time: 3 minutes
Don’t invest unless you’re prepared to lose all the money you invest. This is a high-risk investment and you are unlikely to be protected if something goes wrong. Take 2 minutes to learn more
In the previous analysis, Tamadoge (TAMA/USD) demonstrated a slight bullish movement, climbing from the $0.00010 level to $0.00011. At the time, expectations were for continued upward momentum. However, the market experienced a swing low, retracing to the $0.000092 level.
Around this point, bullish momentum began to build, sparking a price rebound that broke through multiple resistance levels before facing a tug-of-war near $0.0001276. The recent resurgence raises the question—could this mark the beginning of a sustained bullish uptrend?
Key Price Levels
Resistance: $0.00020, $0.00030, $0.00040
Support: $0.000086, $0.000075, $0.000070

Technical Outlook on the Tamadoge (TAMA/USD) Market
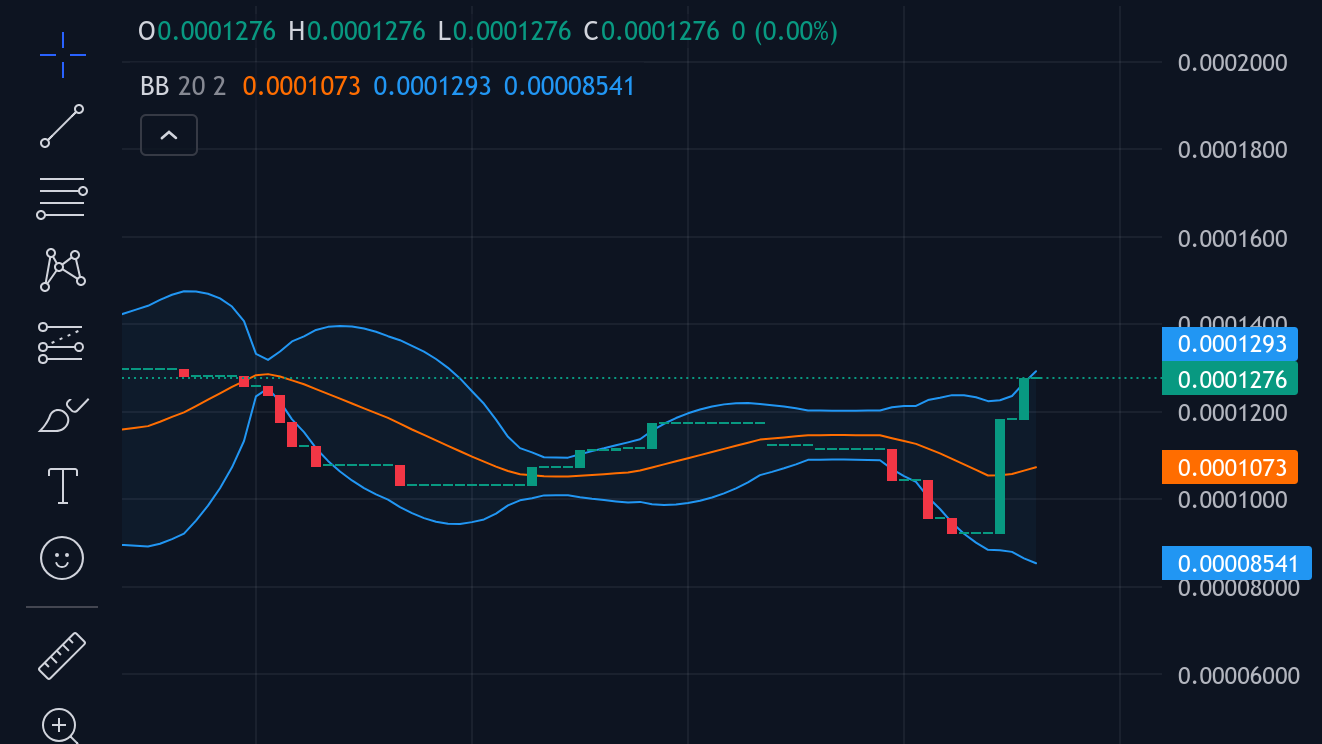
At the current market level of $0.0001276, Tamadoge (TAMA/USD) appears to have a higher likelihood of undergoing a correction than a continued rebound. Viewed through the lens of the Bollinger Bands indicator, the market is positioned in a zone that suggests potential downward pressure.
However, if bullish sentiment persists in the crypto signal, the prevailing resistance level could still be broken. Should this fail to occur, traders may look to re-enter the market around the $0.00012 or $0.0001167 support zones, where potential buying opportunities could emerge.
Short-Term Perspective on the TAMA/USD Market
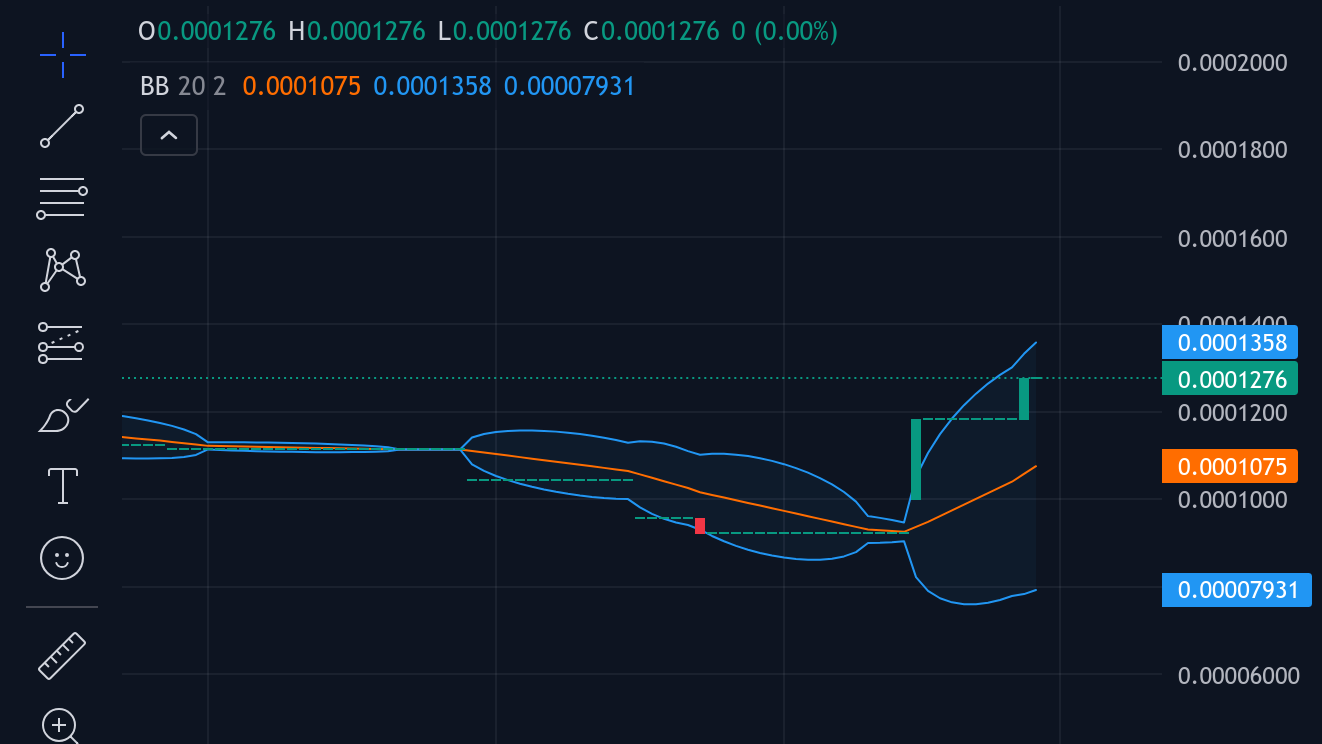
Taking a closer look at the market through the 1-hour chart, Tamadoge (TAMA/USD) continues to consolidate around the $0.000127 level. Despite notable volatility, the Bollinger Bands present a moderately positive outlook, as they tilt upward while maintaining considerable bandwidth.
This configuration suggests that whichever side—demand or supply—gains dominance next, the market could experience significant price swings. In essence, the stage is set for a potential breakout, with volatility likely to amplify the next directional move.
Buy Tamadoge!
There’s no mobile runner out there quite like #TamadogePursuit! 🏃♂️
1️⃣ Sign up – start with 20 free credits for a boost!
2️⃣ Climb up the leaderboards.
3️⃣ Win $TAMA rewards!Play Now! 👇
📱Android: https://t.co/Of8SYALRzL
📱 iOS: https://t.co/IthvqovwAH pic.twitter.com/84HNqob9Rf— TAMADOGE (@Tamadogecoin) September 10, 2024