Tamadoge (TAMA/USD): Stalled at $0.002 – Can Bulls Revive the Price?
Estimated Reading Time: 3 minutes
Don’t invest unless you’re prepared to lose all the money you invest. This is a high-risk investment and you are unlikely to be protected if something goes wrong. Take 2 minutes to learn more
The TAMA/USD market is currently stalling slightly above the $0.002 price level, facing near-term resistance. Can the bulls revive the price? This analysis aims to explore that possibility by considering various market indicators.
Since the last analysis of the Tamadoge market, there has been little change. The price action has shown a minor shift in favor of the bulls, who have emerged to halt the decline at the $0.002 level. Since then, the market has been moving sideways while maintaining a slight bullish advancement. A closer look at the indicators will help assess the market’s condition and potential outcomes.
Key Levels
- Resistance: $0.013, $0.014, and $0.015
- Support: $0.0025, $0.0024, and $0.0023
TAMA/USD Price Analysis: The Indicators’ Point of View
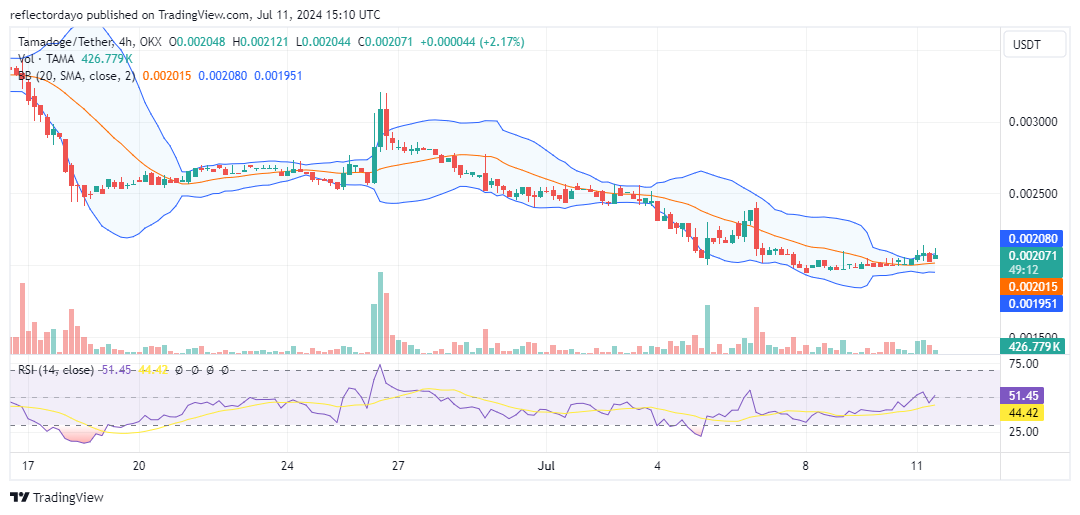
Since the $0.002 price level emerged as a strong support against the bear market, the price action has not fallen below this level. Instead, there have been more movements above it, indicating that bulls are willing to buy. This development (crypto signal) suggests a potential opportunity for the bulls. Additionally, a near resistance level has formed around $0.002086, creating a standoff situation between buyers and sellers. This standoff has led to a decline in volatility, causing the Bollinger Bands to converge into a narrow bandwidth. Typically, such a contraction in the Bollinger Bands signals an imminent breakout.
In addition to the $0.002 price level holding strong, there are other reasons to expect a breakout. The price action is currently above the 20-day moving average, enduring bearish resistance, as bullish traders exert pressure on the $0.002086 level.
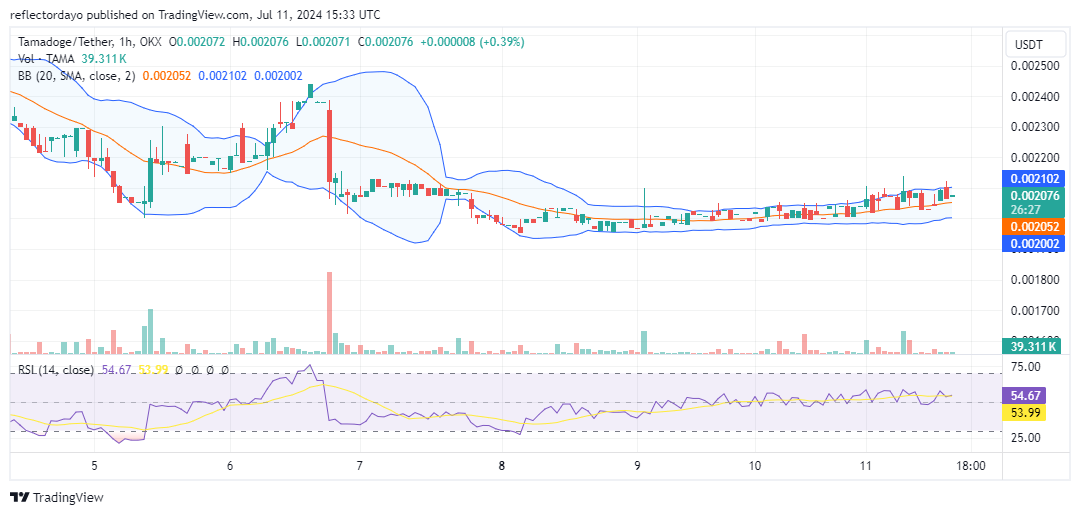
Tamadoge Short-Term Outlook: 1-Hour Chart
Although the significant struggle between bulls and bears is also evident in the 1-hour chart, this perspective offers a more bullish outlook compared to the 4-hour chart. The progression is clearer here. The Bollinger Bands now indicate a more ascending price channel, with the price action testing the $0.0021 level. The divergence from the $0.0020 threshold clearly indicates the bull market’s advancement towards recovery.
Buy Tamadoge!
Flex your muscles with #Tamadoge Pursuit! 💪
Amongst many different settings, race through multiple levels and beat your high score. 💯
Dash over, collect them bones and dodge those wild obstacles! 🏃♂️ 🏃♀️
End goal? Enjoy and earn some $TAMA 😁#CryptoGaming #Cryptocurrency pic.twitter.com/pPjKXnjS2n
— TAMADOGE (@Tamadogecoin) July 9, 2024