Tamadoge (TAMAUSD) to Rally from the $0.0080 Price Level
Estimated Reading Time: 3 minutes
Don’t invest unless you’re prepared to lose all the money you invest. This is a high-risk investment and you are unlikely to be protected if something goes wrong. Take 2 minutes to learn more
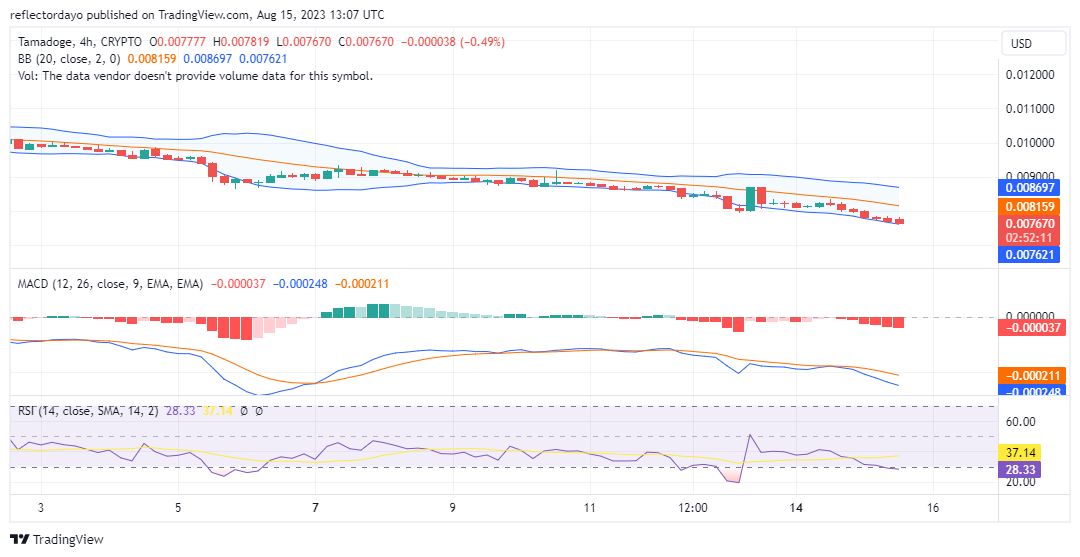
TAMAUSD has undergone a period of intense bearish pressure that pushed its price slightly below the key support level of $0.00800. However, recent price action is showing signs of potential recovery, with a notable shift in momentum that could pave the way for a positive rebound.
The price action below the $0.00800 level has formed three consecutive bearish candlesticks, resembling a doji candle pattern. This pattern reflects uncertainty and equilibrium in the market, suggesting that the bearish momentum is weakening. This indicates that sellers are finding it challenging to push the price lower, and buyers may be starting to regain control.
Key Levels
- Resistance: $0.015, $0.016, and $0.017
- Support: $0.0080, $0.0070, and $0.0065
TAMAUSD Price Analysis: The Indicators’ Point of View
Analyzing the technical indicators further supports this positive outlook. The Moving Average Convergence and Divergence (MACD) indicator is displaying a notable development. The MACD histogram has transitioned into its first faded negative reading, signaling a potential shift in momentum. The MACD line is showing signs of recoiling, indicating that it is preparing to converge with the MACD signal line. This convergence could mark a potential TAMAUSD bullish crossover, suggesting that the bearish trend might be losing steam and a bullish reversal could be on the horizon.
Moreover, the Relative Strength Index (RSI) is providing additional insights into the potential turnaround. The RSI line has reached the edge of oversold territory, indicating that selling pressure has reached an extreme point. The fact that the RSI line is beginning to recoil suggests that buyers could step in, driving the price higher and potentially leading to a reversal in the oversold condition. This movement is a positive sign that market sentiment is shifting in favor of the bulls.
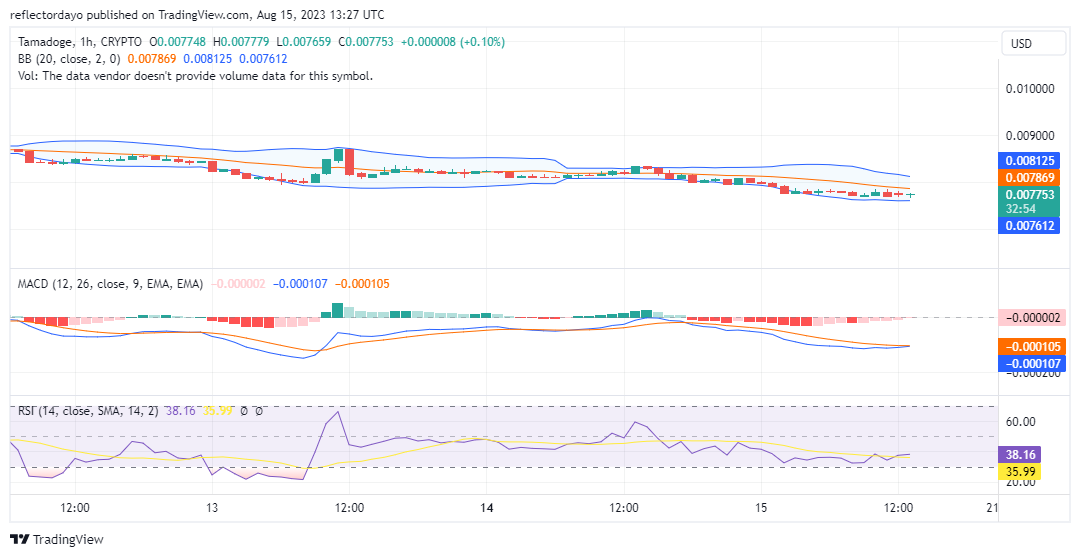
Tamadoge Short-Term Outlook: 1-Hour Chart
Even from a 1-hour chart perspective on the market, TAMAUSD has shown resilience in the face of bearish pressure, as reflected by the doji-like candle pattern and the signs of weakening bearish momentum. The technical indicators, including the MACD histogram and RSI, are aligning with the possibility of a bullish reversal. Traders and investors should closely monitor the price action around the $0.00800 level for potential confirmation of a trend reversal, keeping in mind that a shift in momentum could lead to a positive price movement in the market. Traders should watch out for the bullish crossover in the MACD and the crossover of the 20-day moving average in the Relative Strength Index. The next stop for the market as it rallies might be the $0.00900 price level.
Follow the link below and read about the utility of Tamadoge.
👏 It’s 👏 all 👏 about 👏 the 👏 utility!
To learn more about the utility of $TAMA and the Tamadoge Arcade’s play-to-earn ecosystem, read our blog 👉 https://t.co/n1MbYVUDim pic.twitter.com/v8GT0MyU8i
— TAMADOGE (@Tamadogecoin) August 15, 2023
Do you want a coin that will be 100 times more valuable in the next few months? That is Tamadoge. Buy TAMA today!