The Orca Market (ORCA) Shows Strength Amidst Market Volatility, Eyes $3.00
Estimated Reading Time: 2 minutes
Don’t invest unless you’re prepared to lose all the money you invest. This is a high-risk investment and you are unlikely to be protected if something goes wrong. Take 2 minutes to learn more
In the previous analysis of the Orca market, the crypto signal may have caused some anxiety among traders as it appeared that the market’s bullish gains would be eroded by a strong bearish trend. However, the significant bullish recovery observed in the last analysis has continued, demonstrating that the market, despite ongoing bearish pressure, has the potential for a bullish breakout above the $3.00 price level. The candlestick representing the day’s activities indicates an equilibrium between demand and supply, with the bears holding a slight upper hand.
The Orca Market Data
- ORCA/USD Price Now: $2.234
- ORCA/USD Market Cap: $130 million
- ORCA/USD Circulating Supply: 51 million
- ORCA/USD Total Supply: 100 million
- ORCA/USD CoinMarketCap Ranking: #265
Key Levels
- Resistance: $3.00, $3.50, and $4.0
- Support: $2.20, $2.00, and $1.50.
The Orca Market Through the Lens of Indicators
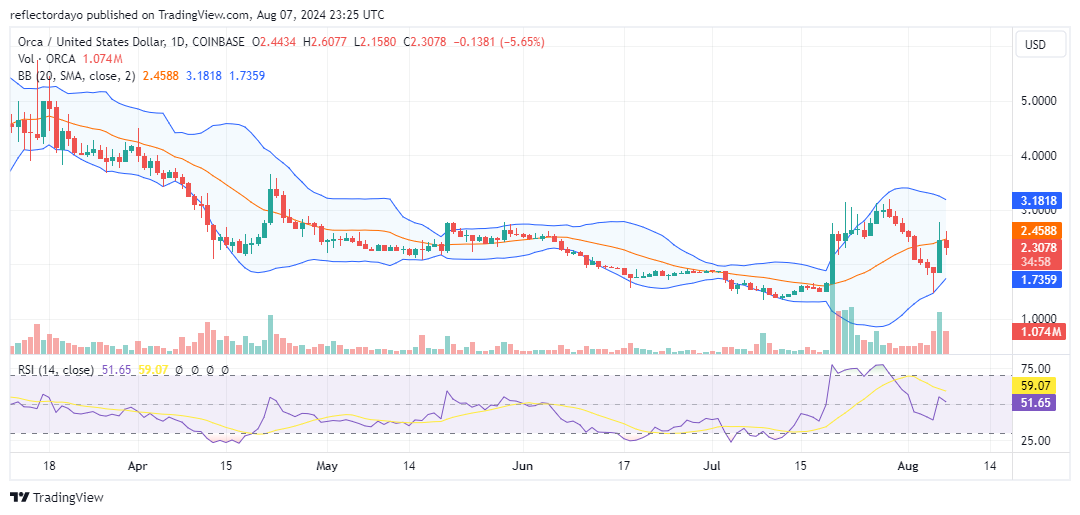
The Bollinger Bands, which reflect the Orca market volatility, were affected by the previous brief sell-off and the rapid bullish recovery. However, as the market steadily maintains its upward trajectory, the Bollinger Bands are beginning to converge, indicating a decline in market volatility. This convergence suggests that bullish forces are matching up with bearish forces.
In the last analysis, we observed resistance at the $2.50 level, but the resilience of the bulls, which has kept the price around $2.234 despite the bearish pressure, indicates that the market may be primed for a bullish breakout above $3.00. Such a breakout could attract additional bullish momentum.
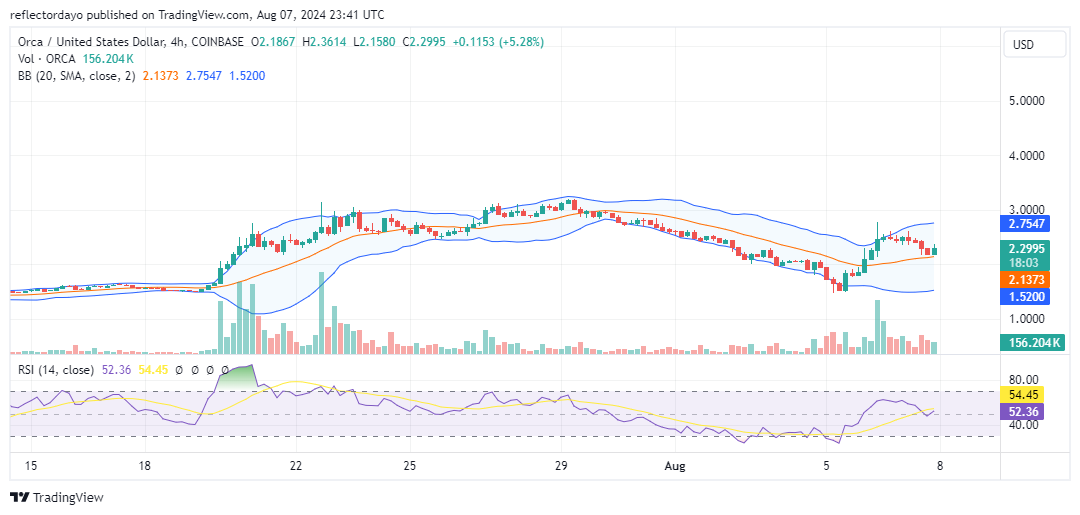
ORCA/USD Price Prediction: 4-Hour Chart Analysis
Despite being rejected at the $2.55 price level, the bulls have stepped in at $2.17, a point directly above the 20-day moving average and precisely at the midpoint of the Relative Strength Index (RSI). This dynamic demonstrates bullish strength. However, traders should remain cautious as bearish momentum has not completely dissipated, as evidenced by the upper shadow on the latest candlestick. Nevertheless, the bulls have established their dominance by rebounding above the 20-day moving average.