UMA Token (UMA/USD) Encounters Strong Resistance at $2.50 Level
Estimated Reading Time: 3 minutes
Don’t invest unless you’re prepared to lose all the money you invest. This is a high-risk investment and you are unlikely to be protected if something goes wrong. Take 2 minutes to learn more
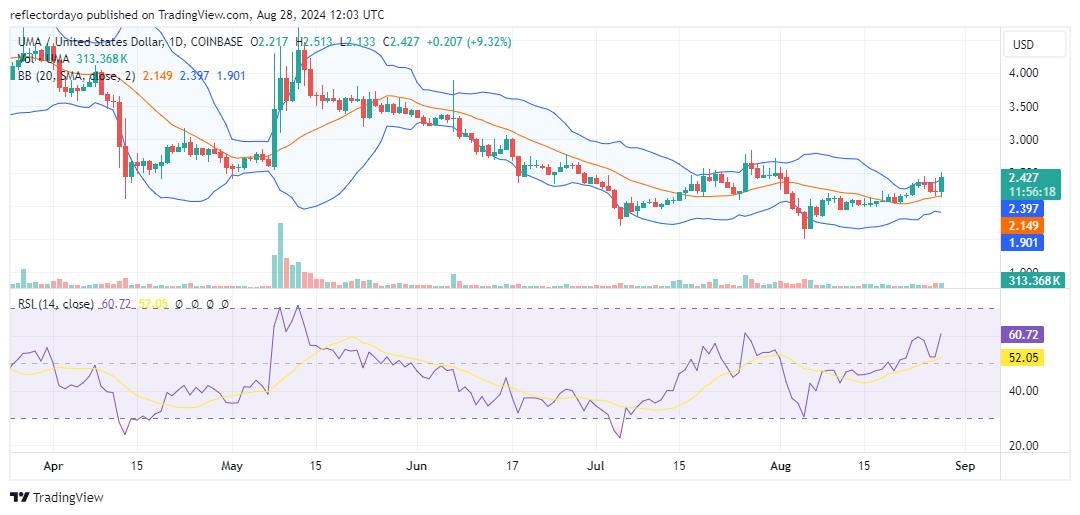
So far today, the UMA token has gained approximately 8%, with the market currently facing resistance at the $2.50 price level. In late August, bullish traders attempted to hold this level after pushing the market above it. However, the bearish pressure at this height proved too strong, causing the bulls to lose their grip and allowing the bears to quickly reclaim control. Today, we see significant price action approaching this level once again, but bearish sentiment around $2.50 remains evident.
The UMA Token Market Data
- UMA/USD Price Now: $2.42
- UMA/USD Market Cap: $198 million
- UMA/USD Circulating Supply: 82 million
- UMA/USD Total Supply: 121 million
- UMA/USD CoinMarketCap Ranking: #197
Key Levels
- Resistance: $2.50, $3.00, and $3.50
- Support: $2.30, $2.00, and $1.50.
The UMA Token Market Through the Lens of Indicators
The upper shadow on the most recent candlestick, representing today’s trading activity, indicates bearish sentiment at the $2.50 price level. However, the significance of the candlestick’s body suggests that substantial bullish sentiment remains, potentially driving the market further upward. Despite this crypto signal, a broader perspective, characterized by descending peaks, indicates the market is trending bearish. If the bulls can achieve a breakout above the critical $2.50 level, it would signal a shift in market dynamics in favor of the bulls. Currently, the price action remains below $2.50, and until a breakout occurs, we cannot conclude that the market has adopted a bullish stance. Additionally, the small histograms from the volume indicator suggest that even the ongoing bullish momentum may struggle to withstand the resistance at the $2.50 level.
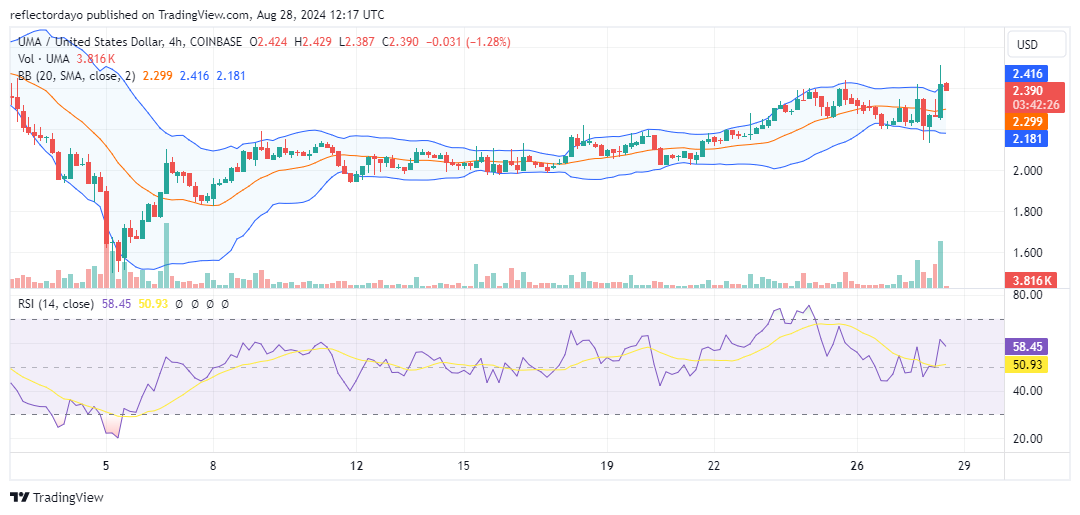
UMA/USD Price Prediction: 4-Hour Chart Analysis
The 4-hour chart indicates high volatility in the market, even though these oscillations are occurring within a relatively narrow price channel. This suggests that a breakout or breakdown may not be imminent. The previous 4-hour trading session showed significant trading volume; however, the current session is marked by a sharp decline in histogram height. This decline indicates that the bulls may not have enough strength to drive the market higher. As a result, the market is likely to continue consolidating at this key price level for the time being.


