Uniswap (UNI) Price Prediction: UNI/USDT Captures Minimal Gains
Estimated Reading Time: 3 minutes
Don’t invest unless you’re prepared to lose all the money you invest. This is a high-risk investment and you are unlikely to be protected if something goes wrong. Take 2 minutes to learn more

Date: September 11, 2025
The Uniswap market has been able to capture some signs of life as price action keeps moving upward toward a technical price level. At the moment, price action in this market occupies a key technical level and, as such, signals that additional upward movements may still be registered.
UNI/USDT Long-Term Trend — Bullish (Daily Chart)
Key Price Levels
Resistance: $10.00, $11.00, $12.00
Support: $9.00, $8.00, $7.00
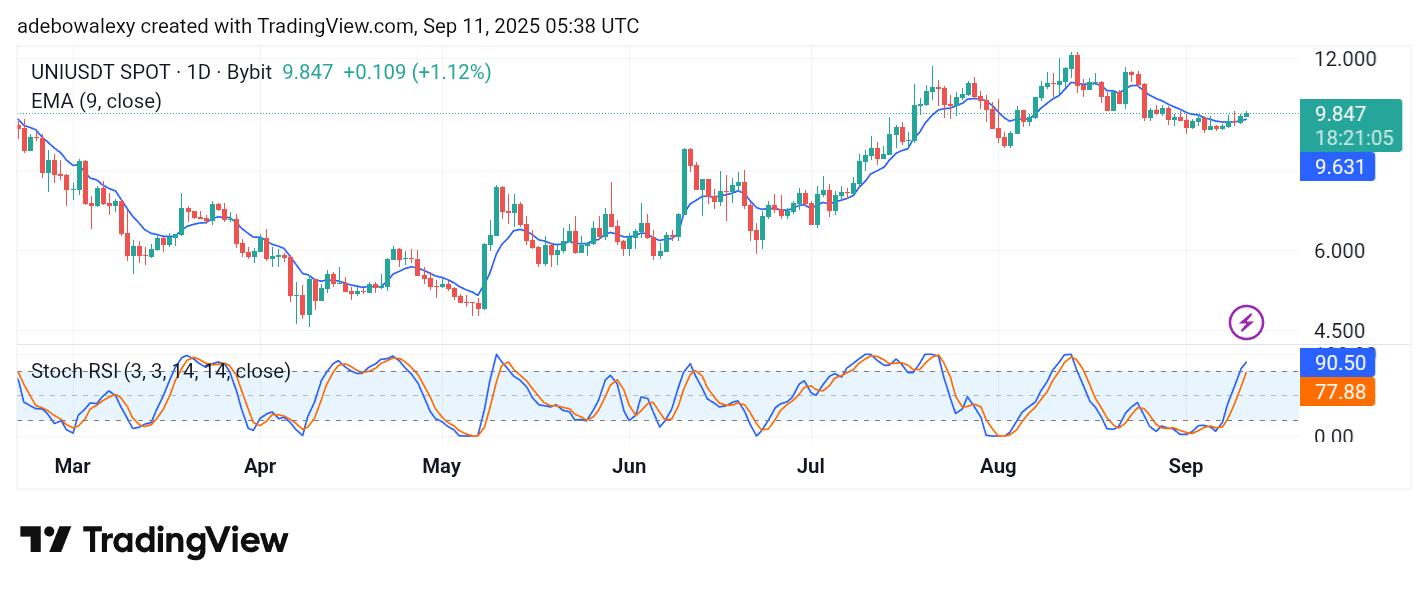
The Uniswap market has edged further upward in the ongoing session. The last price candle on the token’s 24-hour chart is a green one. Likewise, it stands just above the 9-day Exponential Moving Average (EMA) line. Meanwhile, the lines of the Stochastic Relative Strength Index (SRSI) indicator can be seen proceeding higher into the overbought zone, with the lead line now at the 90 level.
Uniswap Price Prediction: UNI/USDT Market Heads Toward the $10 Mark
As price activity in the Uniswap market has risen past the 9-day Exponential Moving Average (EMA) line, it appears this market is taking on a more promising outlook. The last price candle on the chart has appeared green and has edged higher than that of the previous session.
This shows a positive development in the market. Likewise, the SRSI indicator has also climbed further into the overbought region with the lead line at 90. Albeit, the height reached by the SRSI lines suggests that traders may want to start applying caution due to the overbought condition.
Uniswap Price Prediction: UNI/USDT Sees Minimal Rejection (4-Hour Chart)
While price action in the Uniswap 4-hour market stays consistently above the 9-day EMA curve, it can be seen that downward forces are exerting some pressure. The last price candle here is a red one, but it has introduced only a minimal decline as the token continues trading above the 9-day EMA line.
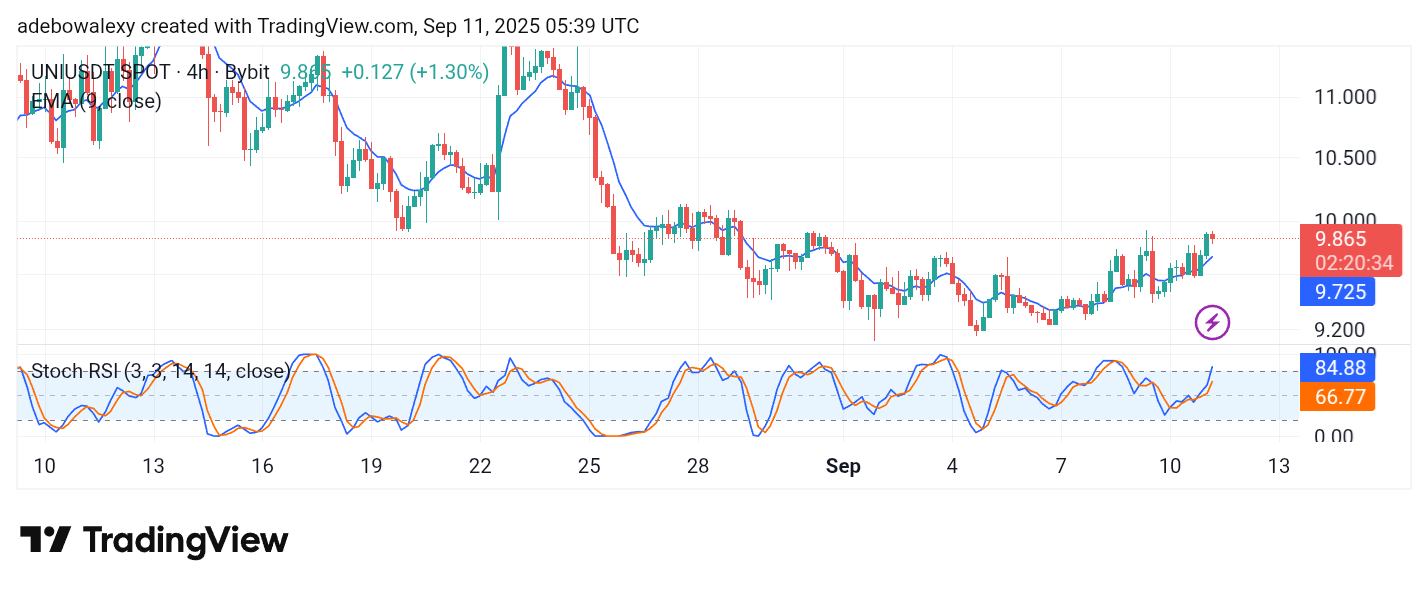
It can be observed that bulls are still dominant in this market, judging from the stance of price action. The SRSI indicator lines are still pointed straight upward into the overbought region.
Also, the behavior of the SRSI lines suggests that upside forces remain stronger. Therefore, this market is more likely to breach the $10.00 price level and proceed toward at least the $10.50 threshold.