Uniswap (UNI) Price Prediction: UNI/USDT Eyes the $6.500 Threshold
Estimated Reading Time: 2 minutes
Don’t invest unless you’re prepared to lose all the money you invest. This is a high-risk investment and you are unlikely to be protected if something goes wrong. Take 2 minutes to learn more

Date: May 22, 2025
Following the ongoing surge in Bitcoin’s price, other altcoins such as Uniswap (UNI) have begun gaining traction—albeit at a modest pace. UNI is approaching the nearby resistance at the $6.500 level and shows potential for reaching higher price points shortly.
UNI/USDT Long-Term Trend: Bullish (Daily Chart)
Key Price Levels:
Resistance: $6.50, $7.00, $7.50
Support: $6.00, $5.50, $5.00
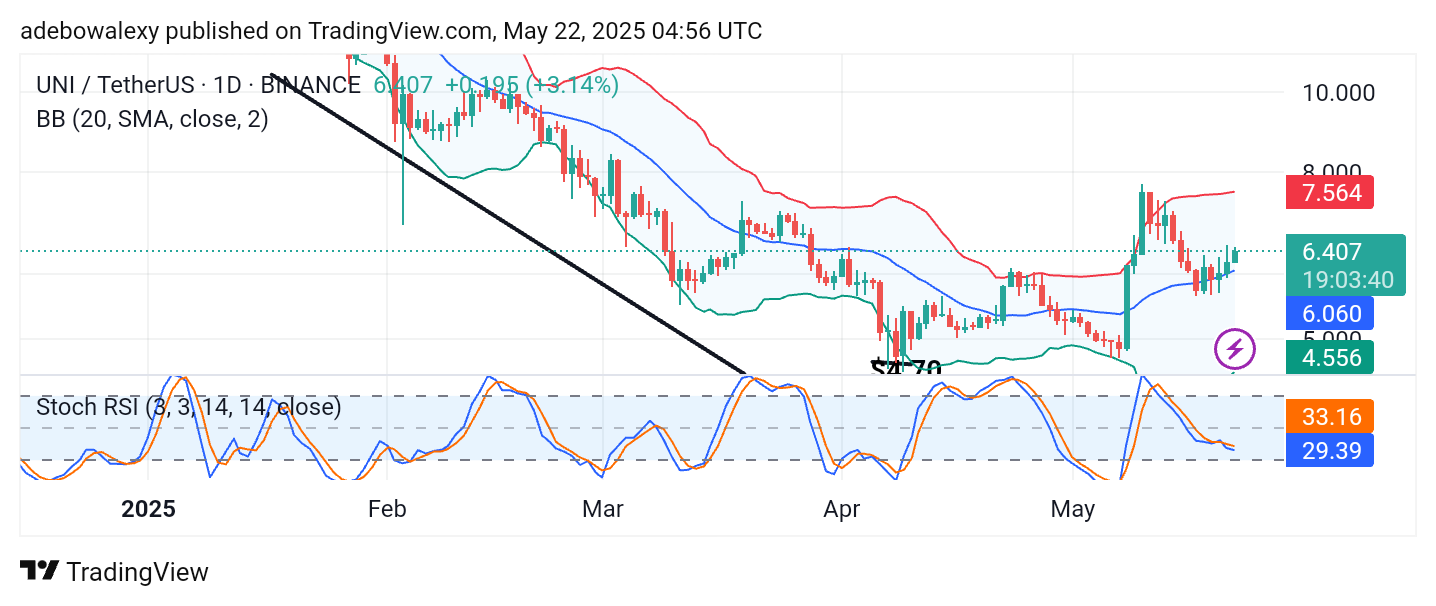
Uniswap’s price action has been bullish over the past two sessions. As a result, the price has been rising off the middle line of the Bollinger Bands indicator. The upper and lower bands remain well-expanded, suggesting increased volatility. Meanwhile, the Stochastic Relative Strength Index (Stochastic RSI) has been falling toward the oversold region in previous sessions. However, due to recent shifts in price movement, the Stochastic RSI lines are now trending sideways.
Uniswap (UNI) Price Prediction: UNI/USDT Is Gaining Momentum
The Uniswap market has been steadily moving upward. The most recent price candle appears larger than previous ones, indicating increasing bullish momentum. The market is also positioned just above the middle line of the Bollinger Bands, which suggests that bullish sentiment remains intact.
Additionally, the Bollinger Bands are still widely expanded, indicating that the trend may continue upward before any potential reversal. Although the Stochastic RSI is not strongly bullish, its gradual upward shift points to growing positive sentiment.
Uniswap (UNI) Price Prediction: UNI/USDT May Hit the $7.00 Mark
On the 4-hour chart, price action shows Uniswap nearing significant technical resistance levels. The latest price candle has tested the upper limit of the Bollinger Bands. This candle is a small red one, indicating a very minor pullback.
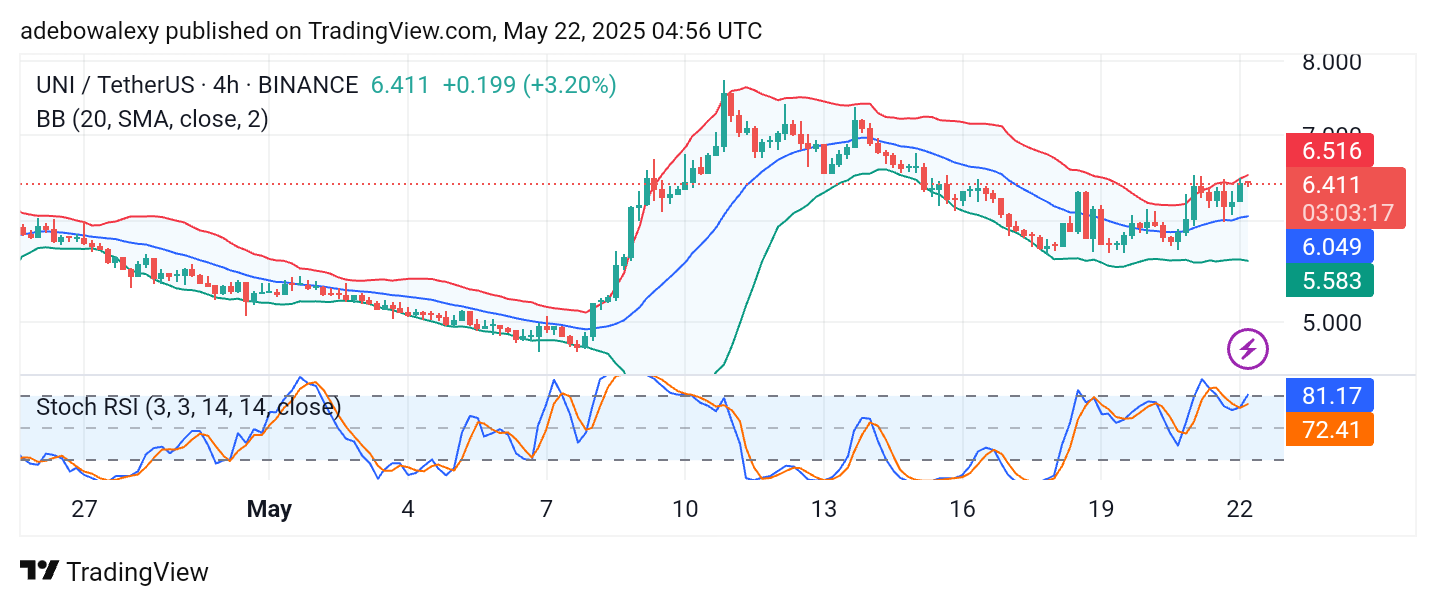
However, its position near the upper band suggests that price action is still holding near key levels. The trajectory of the Stochastic RSI also indicates a possible upward movement, as it is currently in the oversold region and turning upward. Therefore, traders may aim for the $7.00 price level as the next potential target.