Uniswap (UNI) Price Prediction: UNI/USDT Sees a Weak Upward Rebound
Estimated Reading Time: 3 minutes
Don’t invest unless you’re prepared to lose all the money you invest. This is a high-risk investment and you are unlikely to be protected if something goes wrong. Take 2 minutes to learn more

Date: August 28, 2025
The $10 mark had previously represented a stronghold for bulls. However, price action dipped below it under strong bearish pressure. Since then, the token has managed to stage a modest recovery, pushing back above the $10 price mark and thereby sustaining a broader bullish outlook toward the $14 price level.
UNI/USDT Long-Term Trend — Bullish (Daily Chart)
Key Price Levels
Resistance: $11.00, $12.00, $13.00
Support: $10.00, $9.00, $8.00
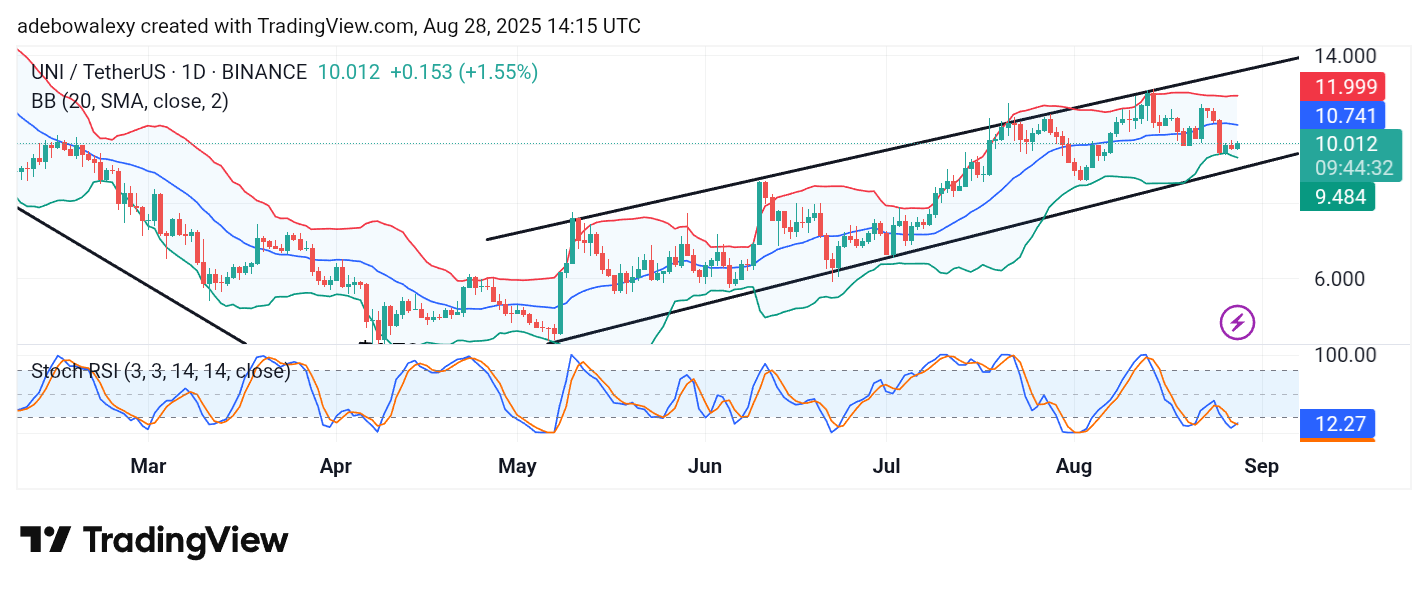
Price action in the Uniswap market has maintained an upward course within the drawn ascending price channel. However, the recent price candle still lingers below the middle band of the Bollinger Bands (BB) indicator. Meanwhile, the ongoing session remains green, though only slightly above the middle band of the BB. At the same time, the Stochastic Relative Strength Index (SRSI) indicator lines are converging for a bullish crossover in the oversold region, hinting at potential upside momentum.
Uniswap Price Prediction: UNI/USDT Current Momentum Is Weak but Keeps a General Trajectory
The Uniswap daily chart reveals that although the recent momentum appears weak, price action still follows a general bullish trend. This is reflected in the modest upward rebound, which has kept the market within the upward-sloping price channel.
Even so, the current session, while bullish, remains below the middle band of the BB indicator. Be that as it may, the SRSI indicator lines are already crossing upward in the oversold region, which therefore suggests that the rebound may continue toward the middle band of the BB indicator.
Uniswap Price Prediction: UNI/USDT Looks Vulnerable but Keeps a Good Base (4-Hour Chart)
On the 4-hour Uniswap chart, it is visible that price activity stands above the middle limit of the BB indicator. However, since then, price action has been consolidating, as recent candles have been red with very limited movement.
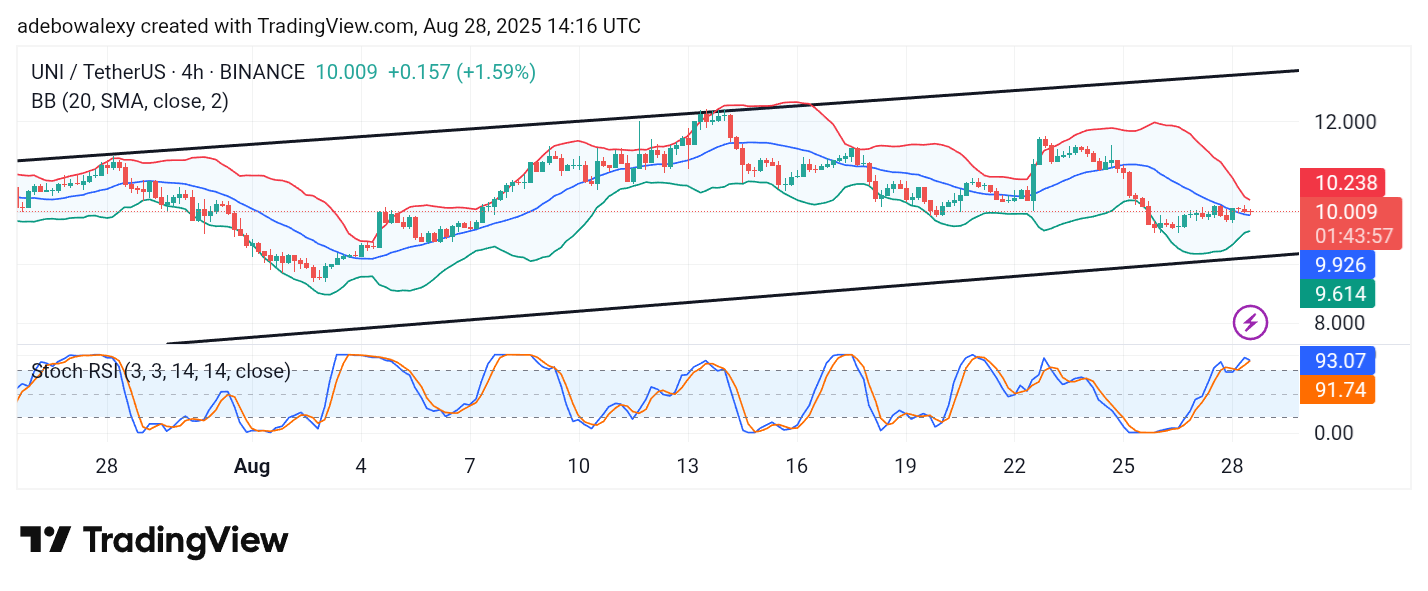
Meanwhile, the upper and lower limits of the Bollinger Bands are converging, signaling that upside forces are building a base from which to launch another push higher.
At the same time, the SRSI indicator lines are positioned in the overbought region and appear to be converging, which technically introduces caution. Therefore, traders may consider waiting for price action to decisively cross the middle band of the BB indicator on the daily chart before adopting a stronger bullish stance toward the $12 price level.