XRP Moves inside a Small Range Due to Resistance at $0.50
Estimated Reading Time: 2 minutes
Don’t invest unless you’re prepared to lose all the money you invest. This is a high-risk investment and you are unlikely to be protected if something goes wrong. Take 2 minutes to learn more

XRP (XRP) Long-Term Analysis: Bearish
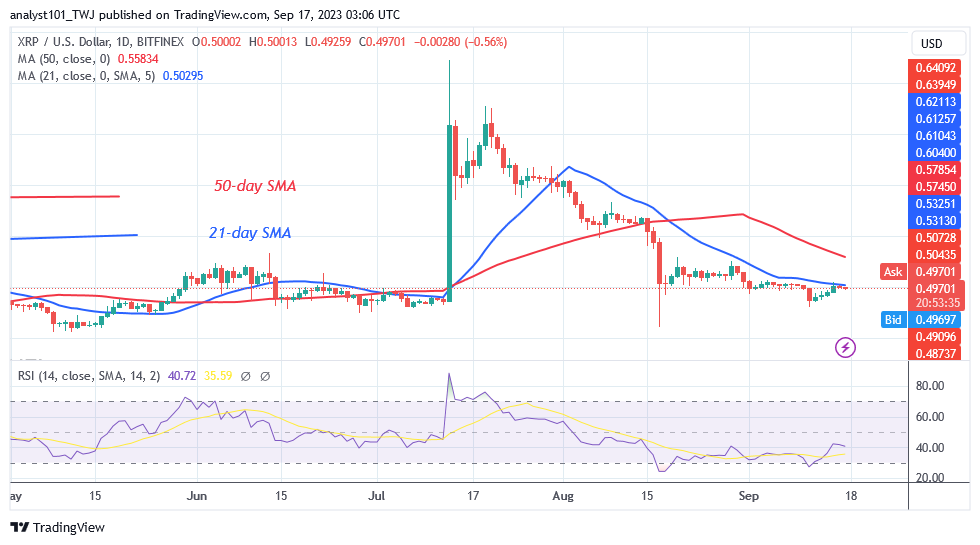
The XRP (XRP) price is in a small range due to the resistance at $0.50. On September 15, the altcoin recovered and reached a high of $0.50. In addition, the 21-day SMA opposes the cryptocurrency’s upward movement. At the latest high, the cryptocurrency is currently limited by the 21-day SMA.
On the plus side, the $0.50 area of the market is overbought.
If sellers appear in an overbought market, XRP will decline. Meanwhile, the altcoin will be trading in a limited range between $0.45 and $0.50. When these levels are breached, the altcoin will trend. For example, XRP will fall further if the bears breach the $0.45 support level. The cryptocurrency will fall to its prior low of $0.42.
Technical Indicators
Major Resistance Levels – $1.00, $1.50, $2.00
Major Support Levels – $0.50, $0.30, $0.10
XRP(XRP) Indicator Analysis
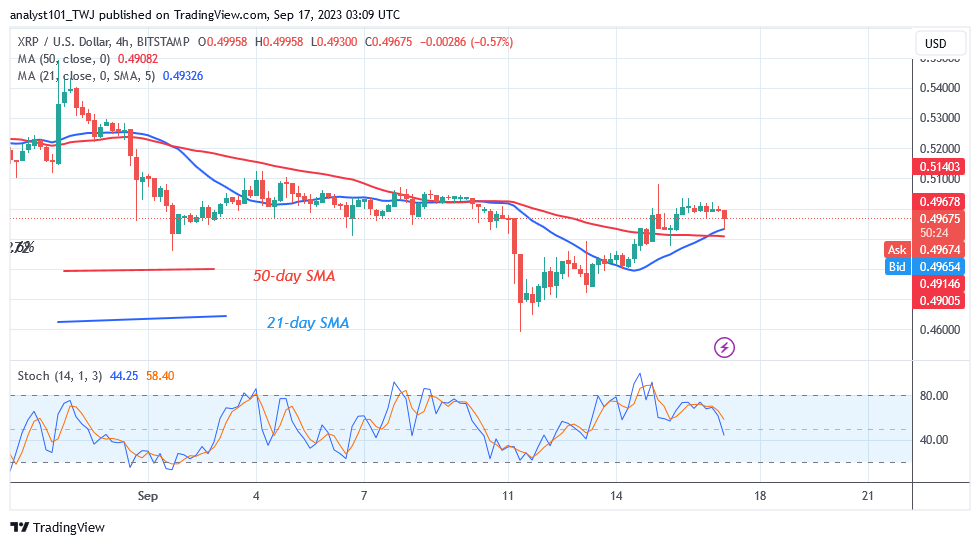
XRP is in a negative trend zone after reaching the Relative Strength Index level 40 for period 14. The price bars are decreasing because the moving average lines are rejecting them. Previously, the crypto asset was in the overbought zone. It is currently in a bearish trend below the daily Stochastic threshold of 66.
What Is the Next Direction for XRP (XRP)?
The cryptocurrency asset is likely to tumble due to the resistance at $0.50. Furthermore, the coin is trading in the market’s overbought zone. As the altcoin trades in a confined range, sellers have arisen. The altcoin will drop to retest its current support level of $0.45.
You can purchase crypto coins here. Buy LBLOCK
Note: Cryptosignals.org is not a financial advisor. Do your research before investing your funds in any financial asset or presented product or event. We are not responsible for your investing results