XRP Price Faces Critical Resistance Test as Bearish Momentum Deepens
Estimated Reading Time: 3 minutes
Don’t invest unless you’re prepared to lose all the money you invest. This is a high-risk investment and you are unlikely to be protected if something goes wrong. Take 2 minutes to learn more
In the last 24 hours, XRP prices have recorded a 4.29% rise following a technical rebound. However, despite the bounce and alignment with the broader market crypto rise, the token is still down by 15% from the weekly perspective.
Meanwhile, the propelling factor for this rise appears to be favorable Japanese regulatory sentiment towards Ripple and improved activities from large investors, which have culminated in an improvement in the relative strength index condition.
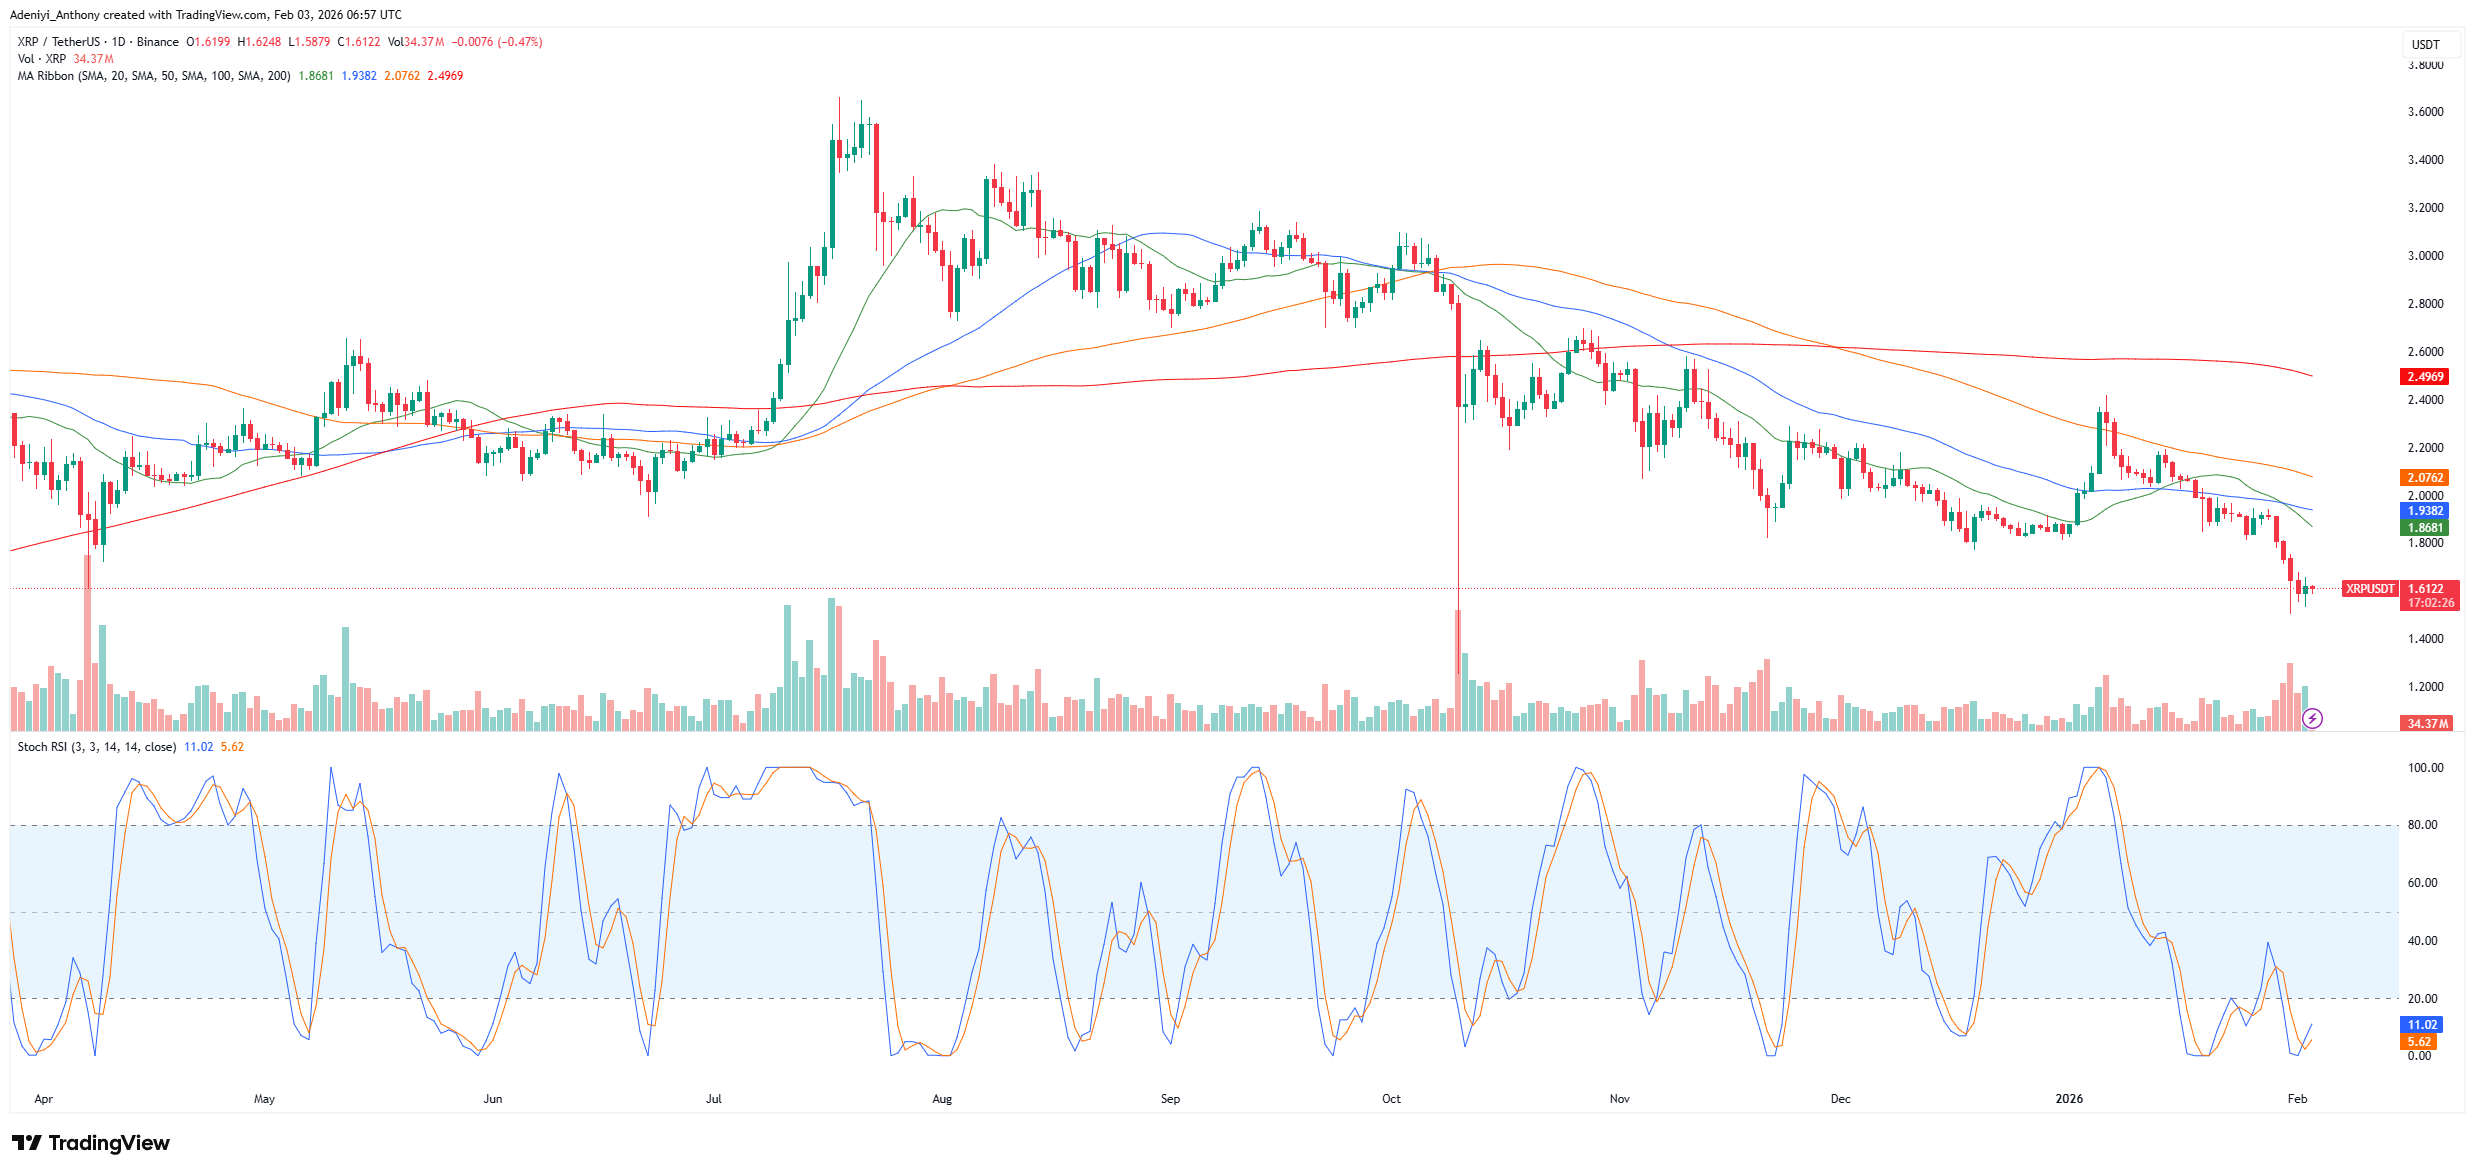
Currently, XRP trades at $1.6122 with over 34 million traded volumes on the daily chart.
Technical Indicator
Major Resistance Levels: $1.86, $2.07, and $2.49
Major Support Levels: $1.60, $1.42, and $1.25
Technical Analysis
On the daily chart, the XRP price is currently navigating a distinct bearish trend on the daily timeframe despite recent gains. As it stands, the price appears to be situated below all major moving averages, indicating that the downside pressure still persists.
Meanwhile, the Stochastic RSI shows an oversold condition with an improving sign of recovery at the bottom. This indicates that while XRP is technically oversold, a bullish reversal is forming. To this end, an increased bullish participatory level is needed for a confirmed break above $1.86; the current trend continues.
XRP Price News Before the Breakout Attempt
Analysis of XRP price shows the token is currently testing a critical Fibonacci support level at $1.55. This is a floor established during the broader Wave 4 correction that began in January 2025. However, while the current bounce remains muted, technical indicators suggest the move down could be nearing completion.
Additionally, the token’s projection shows that a confirmed structural shift into five upward waves could eventually target a major resistance zone between $2.69 and $2.84, with a long-term goal of $5.00+. However, caution is advised, as the market may still form a standard ABC structure.
Meanwhile, it was reported that a successful defense of this $1.55 zone and a break above the immediate resistance range of $1.64 to $1.89 would signal the potential start of a bullish Wave 5.
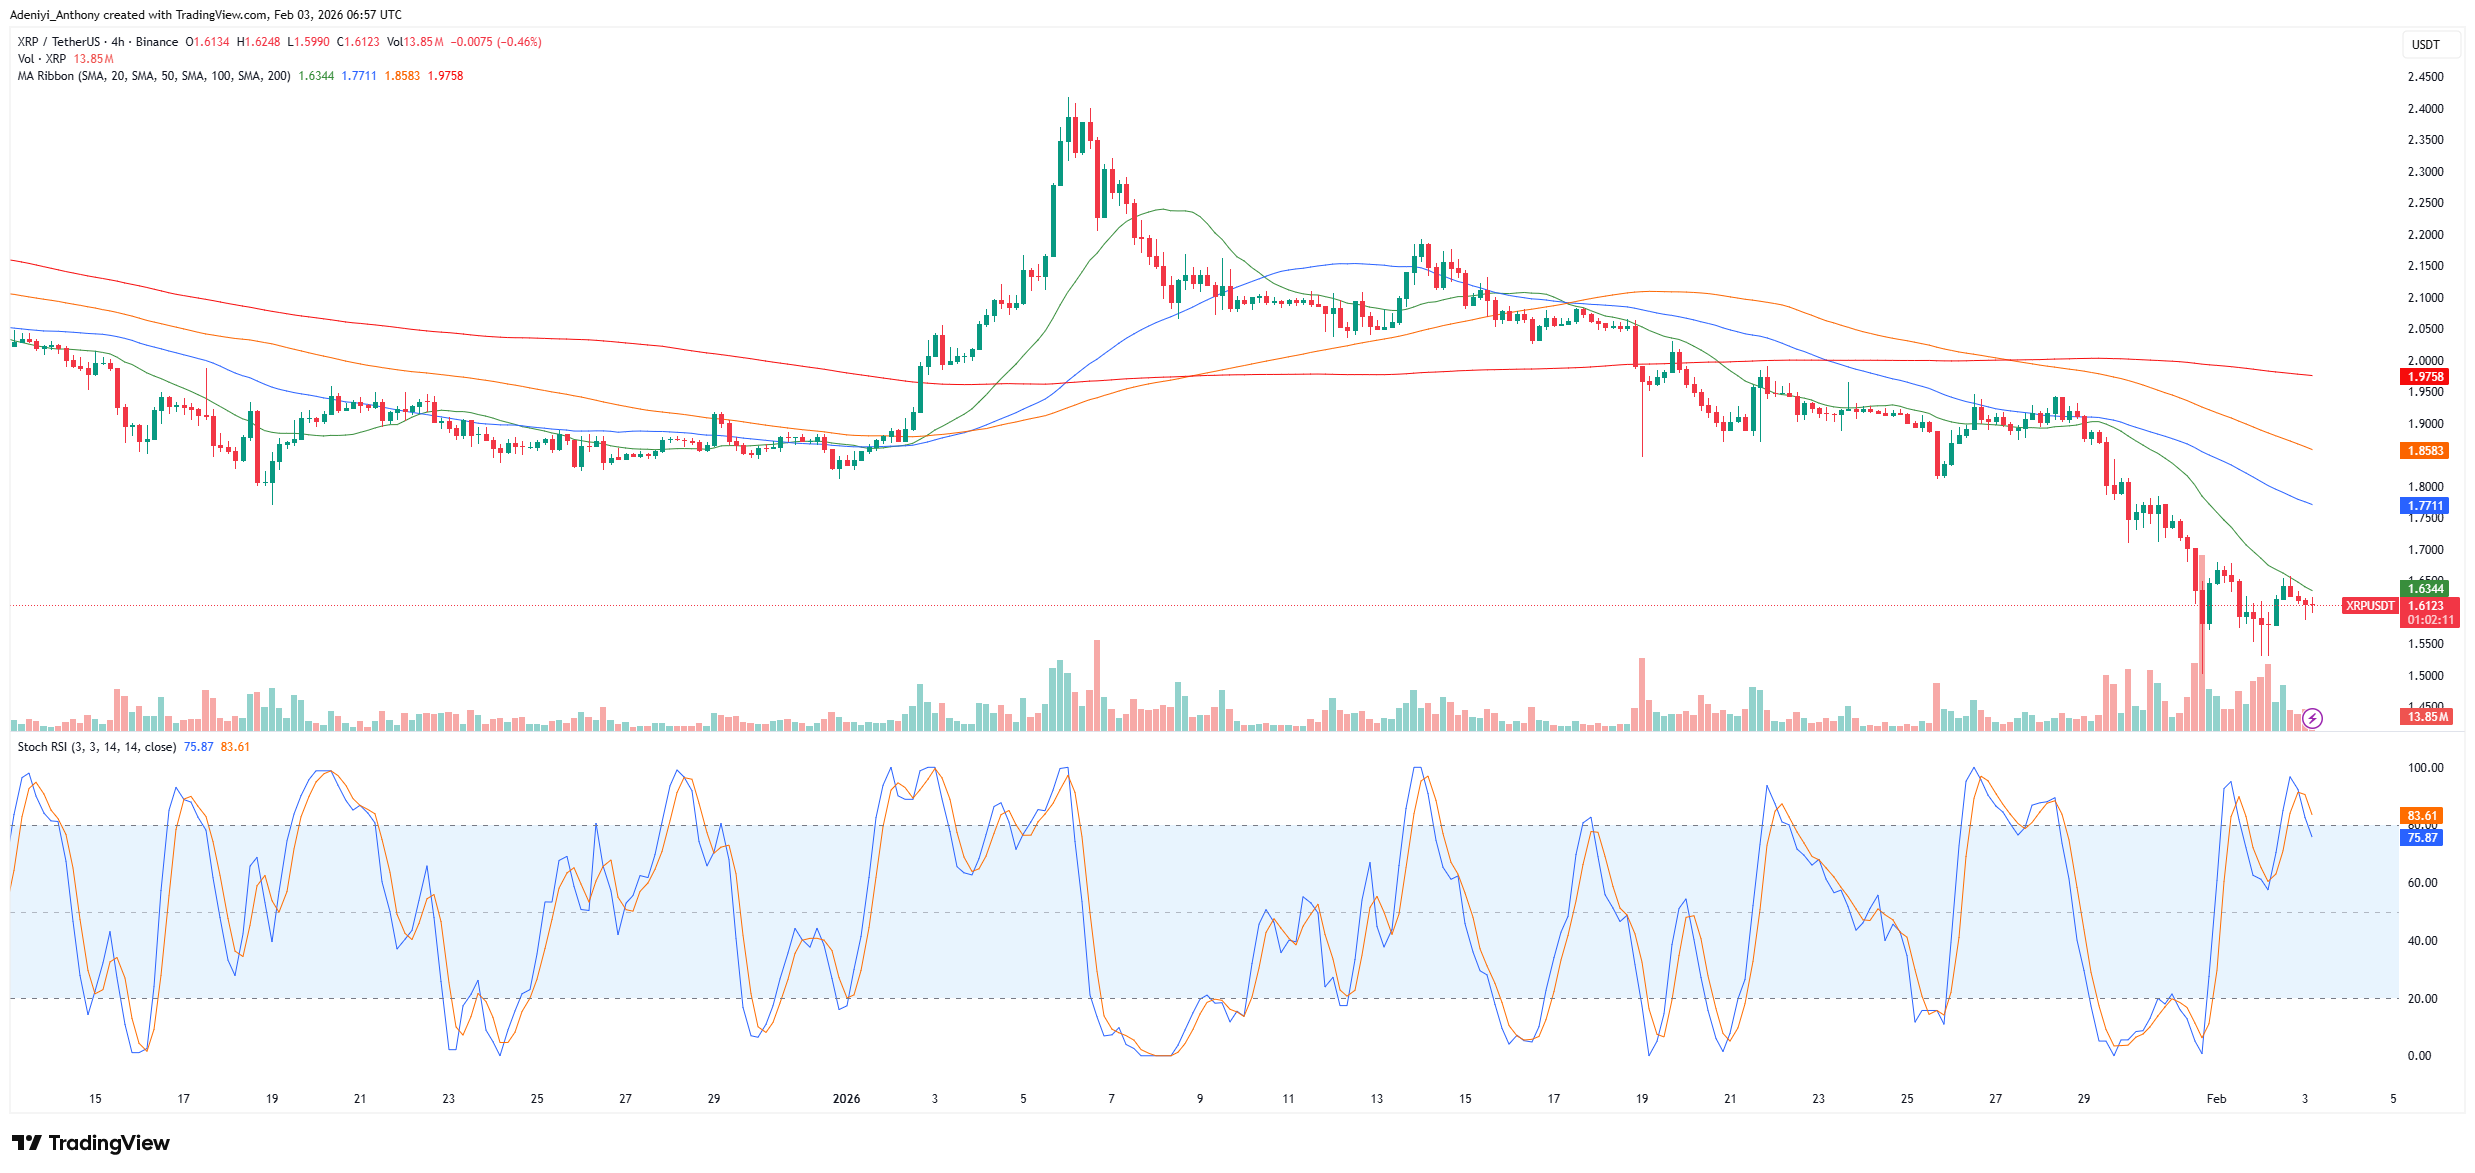
XRP/USDT Analysis: Price Faces Intensified Bearish Momentum
The XRP price on the 4-hour chart seems to be going into a sharp bearish correction after a prolonged consolidation. The price action indicates that after a significant drop from the $2.35 peak seen in early January, the XRP/USDT has entered a lower-low sequence, failing to hold above the psychological support of $1.80, and is currently grappling with a local support zone between $1.60.
From the momentum side, the Stochastic RSI signals an overbought region with the lines pointing to the south. This suggests a $1.25 downside risk without a significant increase in buying volume to reclaim $1.80.
You can purchase crypto coins here. Buy Crypto