XRP (XRP/USDT) Faces Bearish Pressure Above Critical Support Region
Estimated Reading Time: 3 minutes
Don’t invest unless you’re prepared to lose all the money you invest. This is a high-risk investment and you are unlikely to be protected if something goes wrong. Take 2 minutes to learn more
The market against Tether has dropped by 4.53% over the last 24 hours, underperforming the bigger market with more than a $1B liquidation wave and Bitcoin’s fall below $90K weighing on altcoins. The decline was also driven by bearish signals, including an oversold condition of the Stochastic RSI and MACD divergence, as well as muted reactions to Franklin Templeton’s XRP ETF launch, amid broader risk-off sentiment and post-ETF profit-taking.
As it stands, the pair appears to be holding above $2.16; technical indicators around the market show a heavy cloud of bearish presence despite daily participation.
Currently, XRP trades at $2.19 with more than 20 million traded volumes for the day.
Technical Indicators
Major Resistance Levels: $2.21, $2.50, and $3.00
Major Support Levels: $2.10, $2.00, and $1.79
Technical Analysis
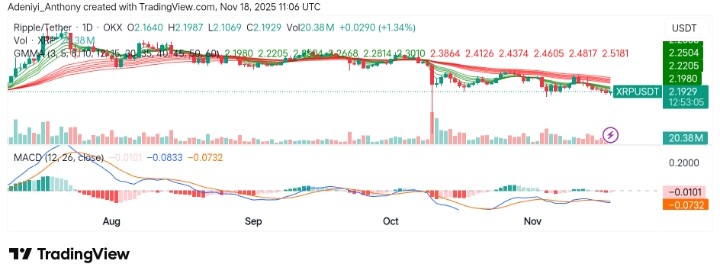
On the daily timeframe, XRP against Tether appears to be battling with strong bearish pressure, facing stronger resistance each time a recovery is to be made. However, it appears that the pair is preparing a move to the north, but the slope of the Guppy Multiple Moving Averages (GMMA) and MACD suggests the bears are not done with their reign, as it appears the more bearish histogram might form soon.
To this end, if the price fails to hold above $2.10, a move towards $2.00 might surface.
The price continues to move sideways. There has been almost no meaningful movement since yesterday. The price has now reached a micro support area, which aligns with the standard Fibonacci zone between 2.16 USD and 2.25 USD.
If XRP starts a larger upward move from here it… https://t.co/YNXXudTlrh pic.twitter.com/1ulTec85kk— More Crypto Online (@Morecryptoonl) November 15, 2025
Meanwhile, @Morecryptoonline has pointed out the need for another low, as the pair seems to be operating under a complex XYZ structure. To this end, the analyst suggested a move towards $1.98 may be recorded.
XRP/USDT Analysis: Bullish or Short-term Bearish Momentum?
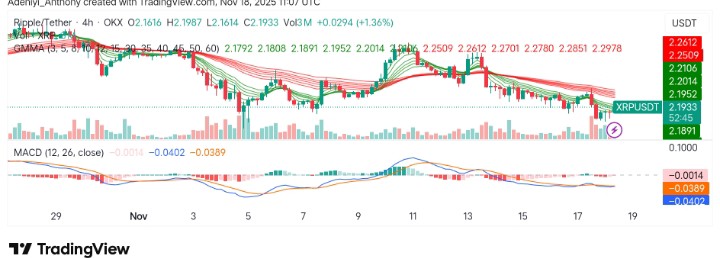
On the 4-hour chart, the analysis of XRP/USDT presents a similar situation. However, it appears that the price is improving despite the signals from the bearish divergence of the GMMA.
From another angle, the MACD signals as bullish seem to be aiming for a move towards $2.21. However, the current position of the price suggests that momentum for an action above this level is not present in the market, as seen in the struggle between bullish and bearish participants.
To this end, the pair may continue to oscillate at the current point until the sentiment around Bitcoin turns bullish.
You can purchase crypto coins here. Buy Crypto