XRP (XRP/USDT) Faces Major Resistance After Recent Sell-Off: Is a Recovery Imminent?
Estimated Reading Time: 3 minutes
Don’t invest unless you’re prepared to lose all the money you invest. This is a high-risk investment and you are unlikely to be protected if something goes wrong. Take 2 minutes to learn more
Recently, the market for XRP against Tether has seen a drop in value beyond $1.200 due to a previous crash in the crypto market. However, the previous candle after this crash has shown the pair is recovering, gearing up for further gains as the price hits a high of $2.6209 as of today.
As it stands, XRP seems to be heading south, as the Guppy Multiple Moving Averages (GMMA) and MACD indicate increasing bearish pressure in the market.
Currently, XRP trades at $2.4549, recording more than 47 million traded volumes for the day.
Technical Indicators
Major Resistance Levels: $2.5163, $2.6072, and $2.7500
Major Support Levels: $2.4185, $2.3500, and $2.2000
XRP Technical Analysis
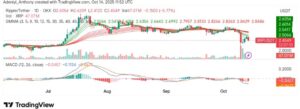
Technically, XRP against Tether has gone down as low as 6% since opening around $2.600 today. Though the pair appears to be improving after the recent market crash, it looks like resistance at $2.6209 seems to be strong as bearish strength improves.
On one hand of the chart, the GMMA signals the bears are dominating, with the positioning of the set of EMAs depicting a bearish setup. On the other hand, the MACD displays a similar opinion as the histogram display, improving bearish pressure.
To this end, only if the XRP improves above $2.6054 is the pair going to go bullish, but for now, a dip below $2.4185 will send the pair further south.
Will XRP Go Lower from Here?
At the moment, the market for XRP seems to be quite tricky, and there is a reason for that. Generally, the market for crypto has responded more to fundamentals, but it appears that XRP had gone bullish before going bearish, as seen in the S&P 500. Meanwhile, the trading volume appears to be improving; should the pair react positively to $2.5500, a move towards $2.7500 may be recorded, but that does not suppose a move to $2.300 is not possible.
XRP/USDT Analysis: Waning Bullish Momentum?
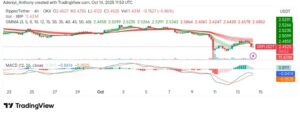
On the 4-hour chart, XRP/USDT seems to be struggling to hold above the major support level, as the GMMA in this timeframe appears to be bending to the south after signs of improvement in recent sessions.
Additionally, the MACD points to a reduction in bullish participation as the histogram heads for the signal line after what seems to be a market bias in favor of the bulls. As it stands, XRP/USDT seems to be struggling with maintaining momentum above the $2.4100 level despite recording more than 11 million traded volumes.
To this end, a break below current support would suggest a continued downtrend.
You can purchase crypto coins here. Buy Crypto