Zcash (ZEC) Extends a Long-Term Upside Correction
Estimated Reading Time: 3 minutes
Don’t invest unless you’re prepared to lose all the money you invest. This is a high-risk investment and you are unlikely to be protected if something goes wrong. Take 2 minutes to learn more

Summary:
- Zcash is gaining bullish momentum, with price trading above the 9-day EMA.
- SRSI remains strongly positive, indicating continued buying pressure.
- ZEC could target $700 if the current bullish trend continues.
While the fundamentals of the Zcash blockchain remain unchanged, the token seems to have gradually and steadily regained its upward traction. Bullish sentiment has strengthened in this market since the beginning of August. Let’s take a closer look at the details below.
Zcash on a Daily Price Chart
As noted above, the ZECUSDT market has been rebounding since the 1st of August. Even during the ongoing session, progress in the upward direction has remained evident. The latest price candle on the chart stands above the 9-day Exponential Moving Average (EMA) line.
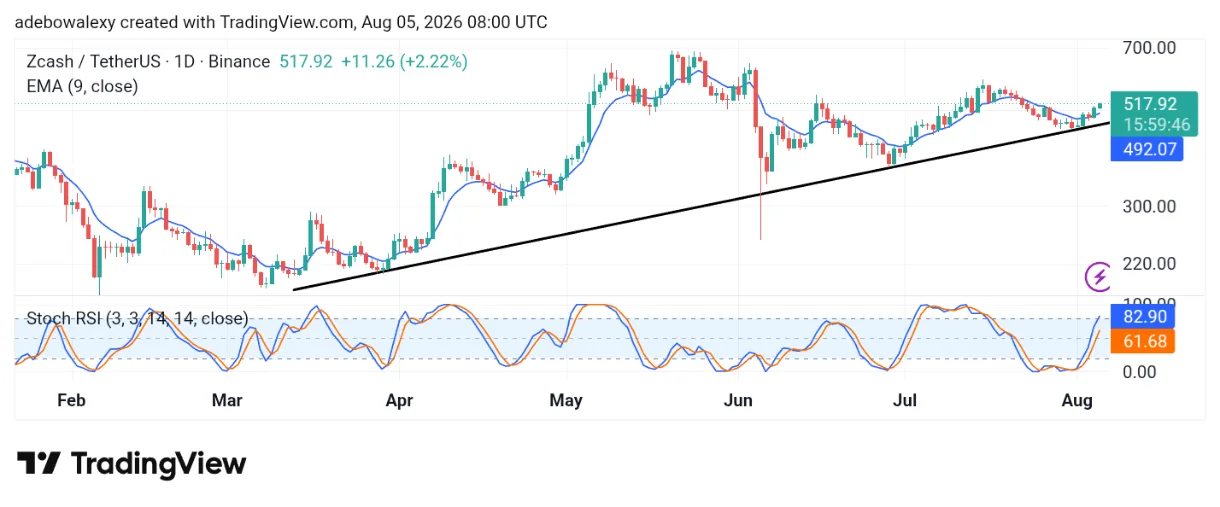
Additionally, it maintains a bullish appearance. As a result, the Stochastic Relative Strength Index (SRSI) lines continue to trend upward toward the overbought region. At the time of writing, the leading SRSI line has moved above the 80 level, while the lagging line remains just above the 60 mark.
ZEC Keeps Focus on the $700 Mark
By observing price activity on the Zcash daily chart, we can see that price action remains on course toward higher levels. Since the start of the new month, bullish momentum has continued to drive the market higher.
Recently, the token climbed above $500, and price action in the current session suggests further gains may be on the horizon, with trading remaining above the 9-day EMA. The SRSI also confirms the strength of bullish sentiment, as the indicator’s lines continue to point upward within the overbought region.

Zcash Traders Can Keep Focusing on the $700 Threshold.
All available indicators on the ZECUSDT daily chart suggest that bullish momentum remains dominant.
The bullish appearance of the latest price candle suggests that buyers continue to maintain control of the market. Additionally, the SRSI supports this outlook, reinforcing the possibility that the market could continue advancing toward the $700 price level.