ZRXUSD Continues to Fall as Sellers Seek to Ride Lower
Estimated Reading Time: 3 minutes
Don’t invest unless you’re prepared to lose all the money you invest. This is a high-risk investment and you are unlikely to be protected if something goes wrong. Take 2 minutes to learn more

Free Crypto Signals Channel
ZRXUSD Analysis: The ZRXUSD price hangs downward, back to the $0.25900 market level
ZRXUSD hangs downward as sellers aim to go lower beyond the $0.25900 key zone. The sell traders are already putting on a show that they want to reduce the coin’s influence more than expected. Although the ZRXUSD had previously shown signs of bullishness in April, at some point, it fell below expectations. The selling strength is yet to cause more impact, even in the coming days. The coin market is falling as sell traders dump the value of the crypto market. A break below $0.25900 will imply that the sellers are still set up to go lower than expected on the daily chart.
ZRXUSD Key Levels
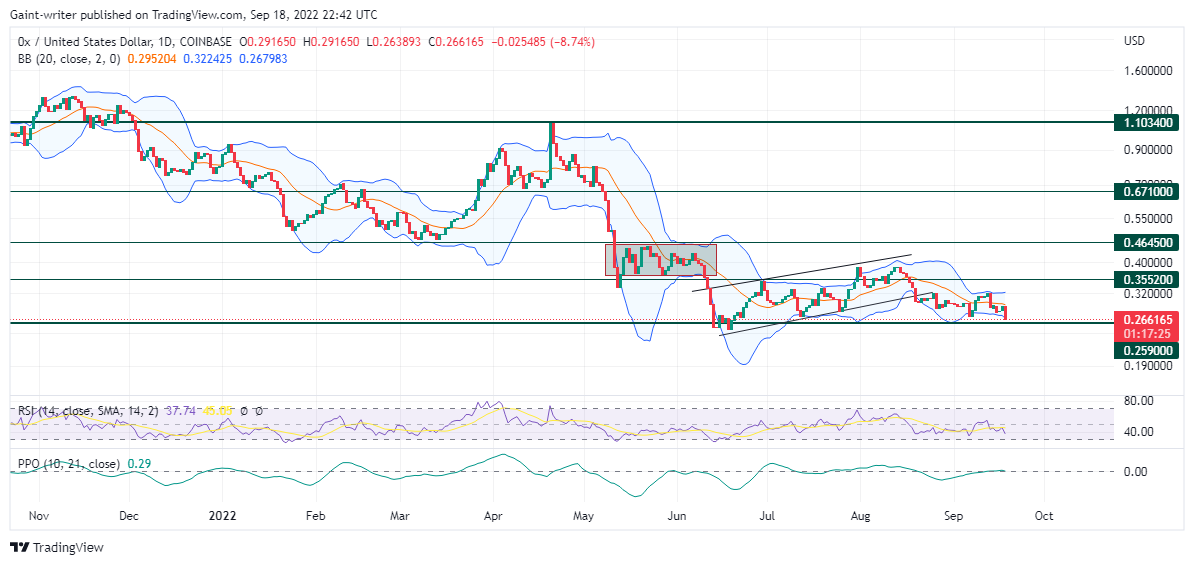
Resistance Levels: $1.103400, $0.464500
Suport Levels: $0.355200, $0.259000
The bulls in April put up a fight as we see advancement following the price swing to the $0.464500 key zone. Buyers appear to be more active, as we see buying interest up to the $1.103400 key zone. However, the buyers failed to put up with more structure as selling resistance led to a heavy drop in the market. The ZRXUSD fell from the resistance level of $1.103400 key zone down to the support zone of $0.259000. We see price accumulation right before further distribution by seers at the order block of $0.355200.
With the price falling, we can now see it ranging between the $0.355200 and $0.259000 key zones. The sell traders are now going south down to $0.25900, and there may be a further decline in price as the days pass. As sellers approach the $0.259000 key zone, the Bollinger Band indicator shows a contraction. The RSI (Relative Strength Index) is also declining below the 40.00 level on the daily chart.
Market Expectations
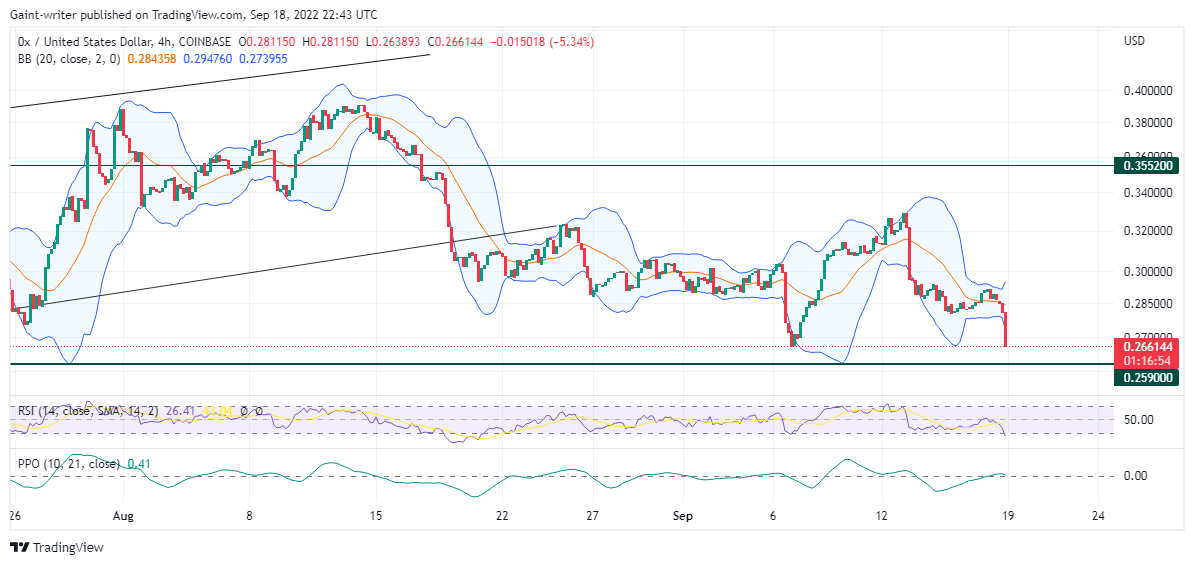
The sellers are aiming for more breakouts below the value of the $0.259000 key zone. The Price Oscillator indicator still had no change as the market tendency is not yet in a clear trend. The sellers’ breaking out of the $0.259000 key zone may result in more falls by the sellers on the 4-hour chart time frame.
You can purchase Lucky Block here. Buy LBLOCK
Note: Cryptosignals.org is not a financial advisor. Do your research before investing your funds in any financial asset or presented product or event. We are not responsible for your investing results.