EigenLayer (EIGEN/USDT) Extends Bearish Momentum
Estimated Reading Time: 3 minutes
Don’t invest unless you’re prepared to lose all the money you invest. This is a high-risk investment and you are unlikely to be protected if something goes wrong. Take 2 minutes to learn more

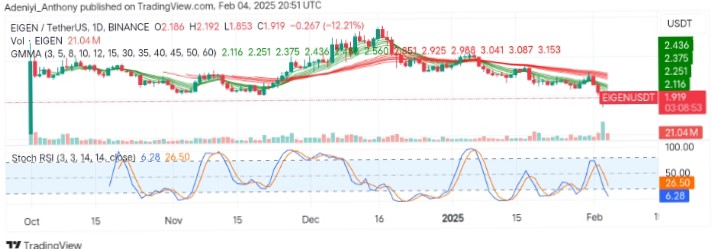
Eigenlayer against the Tether on the daily timeframe seems to be showing a decline in recent trading sessions. This is evidenced in the 12.21% price decline and the formation of several lower lows.
However, the positioning of Guppy Multiple Moving Averages (GMMAs) and the Stochastic RSI suggest the current trend might extend until strong bullish momentum emerges. To this end, the pair operates below a significant resistance at $2.116, signifying that Eigenlayer acts under strong selling pressure and increased volatility.
Currently, Eigenlayer trades at $1.919, recording over 21 million volumes for the day.
Technical Indicators
Major Resistance Levels: $2.116, $2.251, and $2.436
Major Support Levels: $1.850, $1.750, and $1.500
Eigenlayer Technical Analysis
The analysis of Eigenlayer against the Tether on the daily timeframe signals the price has broken below recent support levels, confirming a continuation of a downtrend. However, the GMMAs highlight an extension of bearish momentum as the GMMAs spread below red EMAs after indicating a bearish crossover.
On the other hand, the Stochastic RSI signals an oversold condition, indicating a trend backed up by a strong volume. Despite the below 30-mark level, the price may consolidate in the short term if buyers step in.
To this end, if the price holds above the $1.850 level, a bounce could occur in the short term; otherwise, failure to reclaim a major resistance level may lead to a continuation of a bearish trend.
EIGEN/USDT Analysis: What’s Next?
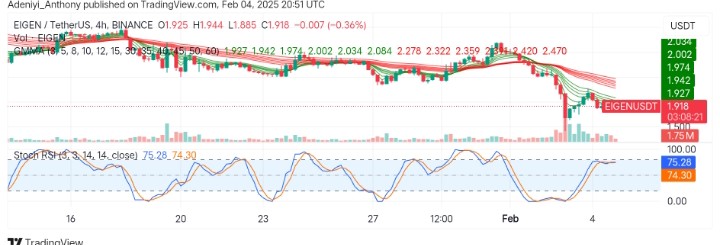
EIGEN/USDT analysis on the 4-hour timeframe shows that the pair has seen a sharp decline, but seems to be attempting a small recovery as the price suspends at $1.918.
The GMMAs show the pair is on a downtrend. However, the flattened EMAs suggest bearish momentum may be slowing down.
The Stochastic RSI signals a near-overbought condition as the lines read slightly above the 70-mark level. However, the suspended lines indicate a potential pullback unless volume and sustained buying pressure are recorded.
To this end, a break above the $1.970 resistance level could make the price embark on a bullish recovery; otherwise, the bearish trend may resume.
You can purchase crypto coins here. Buy LBlock