Eigenlayer (EIGEN/USDT) Faces Prolonged Selling pressure
Estimated Reading Time: 3 minutes
Don’t invest unless you’re prepared to lose all the money you invest. This is a high-risk investment and you are unlikely to be protected if something goes wrong. Take 2 minutes to learn more

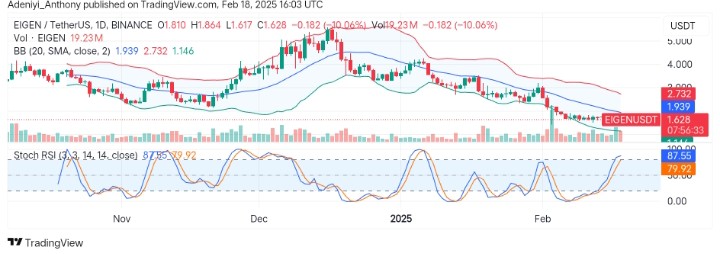
The market for Eigenlayer against the Tether on the daily timeframe has trending downwards after reaching a height of about $5.000 level around the December 2024. This is seen in the formation of lower lows with occasional range-bound movement.
Recently, Eigenlayer has been moving sideways just above the lower Bollinger band, denoting a strong pressure from the bears. However, the position of the Stochastic lines shows that the pair has tendency to move to the north. However, with the current trend, EIGEN/USDT may face further downtrend if it fails to hold above the current level.
Currently, Eigenlayer trades at $1.628, with over 10% decline in the price value compared to last session value.
Technical Indicators
Major Resistance Level: $1.939, $2.732, and $3.000
Major Support Level: $1.617, $1.15, and $0.90
Eigenlayer Technical Analysis
The analysis of Eigenlayer against the Tether on the daily timeframe shows the pair is on a prolonged downtrend with occasional period of indecision. However, the operation between the lower segment of the Bollinger bands shows that the pair is still in the oversold region with a condition for reversal to be increase in buying volume.
On the other hand, the Stochastic RSI signals an overbought condition for the pair as the values of the lines reading an oversold condition. This suggests recent buying activities has been short-lived, and the market may witness another round of price deepening in the near term.
To this end, further movement to the south may be seen, if the price fails to operate above the $1.628 level, as the overall market sentiment Remain bearish.
EIGEN/USDT Analysis: What to Expect
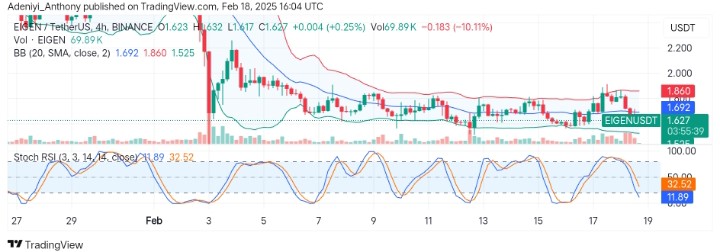
On the 4-hour chart, EIGEN/USDT shows more sign of further downtrend while operate under the mid –level. However, the values of the oscillator at 11.89 and 32.45 suggest the pair may be due for upside bounce.
To this end, volume needs to relatively increase and break above the $1.617 for a short term bounce to the north. Conversely, a break below the current level would signals an extension of the current trend to the $0.9000 despite today’s price deepening.
You can purchase crypto coins here. Buy LBlock