IMPTUSDT Price: Double Bottom Chart Pattern at $0.0047 Position
Estimated Reading Time: 3 minutes
Don’t invest unless you’re prepared to lose all the money you invest. This is a high-risk investment and you are unlikely to be protected if something goes wrong. Take 2 minutes to learn more

Buyers are getting ready take over
IMPT (IMPTUSDT) Price Analysis – January 29
The critical support level of $0.0047 may be broken lower and the lows of $0.0045 and $0.0043 may be hit if sellers add more assets. The $0.0049 resistance level can be broken higher, challenging the $0.0052 and $0.0055 levels, as buyers gain momentum in IMPTUSDT market.
IMPTUSDT Market
Key Levels:
Resistance levels: $0.0049, $0.0052, $0.0055
Support levels: $0.0047, $0.0045, $0.0043
IMPTUSDT Long-term Trend: Bullish
Despite having influence over IMPT, sellers are opposing the upward trend. At the $0.0067 resistance level, the price reached its top. For a few days, the price stays at the same level. The price breached the $0.0065 and $0.0055 support levels as the bears grew more powerful. It retested the $0.0055 after pulling back. On January 9, the price broke through the $0.0052 support level and challenged the $0.0049 support level. Despite the price decline, it is currently attempting to break over the predetermined level of $0.0049.
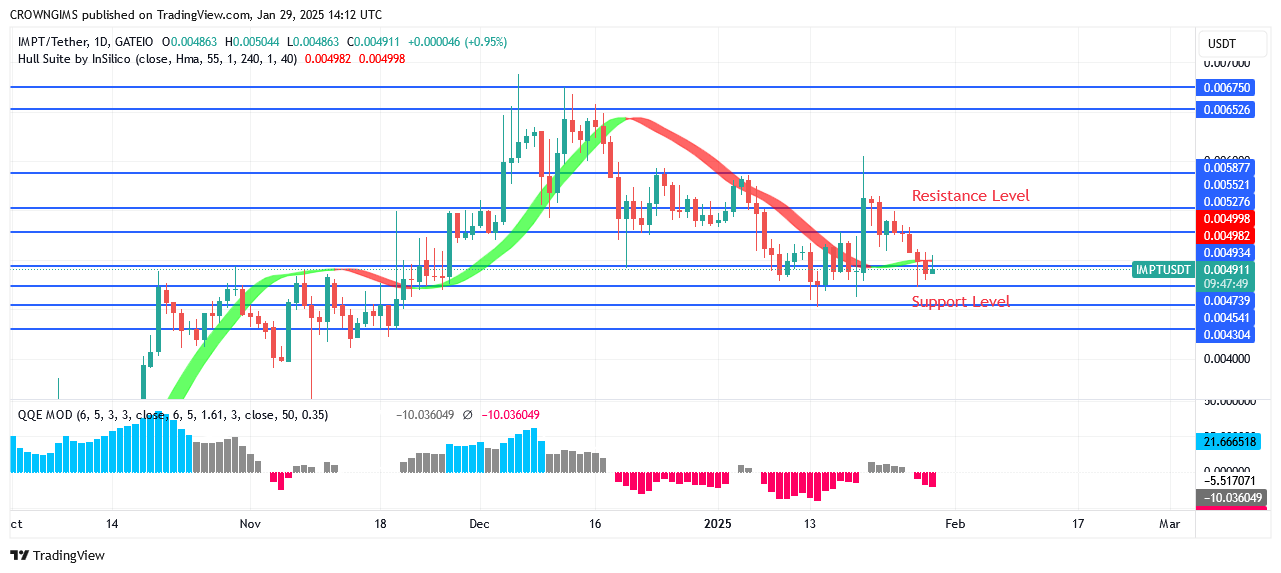
The market is dominated by buyers, according to the daily chart. On the daily chart, the price movement has resulted in a double bottom pattern. Right now, the cost is going down. The critical support level of $0.0047 may be broken lower and the lows of $0.0045 and $0.0043 may be hit if sellers add more assets. The $0.0049 resistance level can be broken higher, challenging the $0.0052 and $0.0055 levels, as buyers gain momentum. A buy signal is indicated when the QQE MOD’s histogram is greater than zero.
IMPTUSDT Medium-term Trend: Bullish
The 4-hour chart pattern indicates that IMPT is performing nicely. On the 4-hour chart, the bears have been exerting pressure on the cryptocurrency’s performance. Following the long-term consolidation breakthrough. The cost keeps going up. On December 12, the $0.0065 resistance level was examined. The gain was stopped by the sellers’ drive, and it is now testing the $0.0049 level.
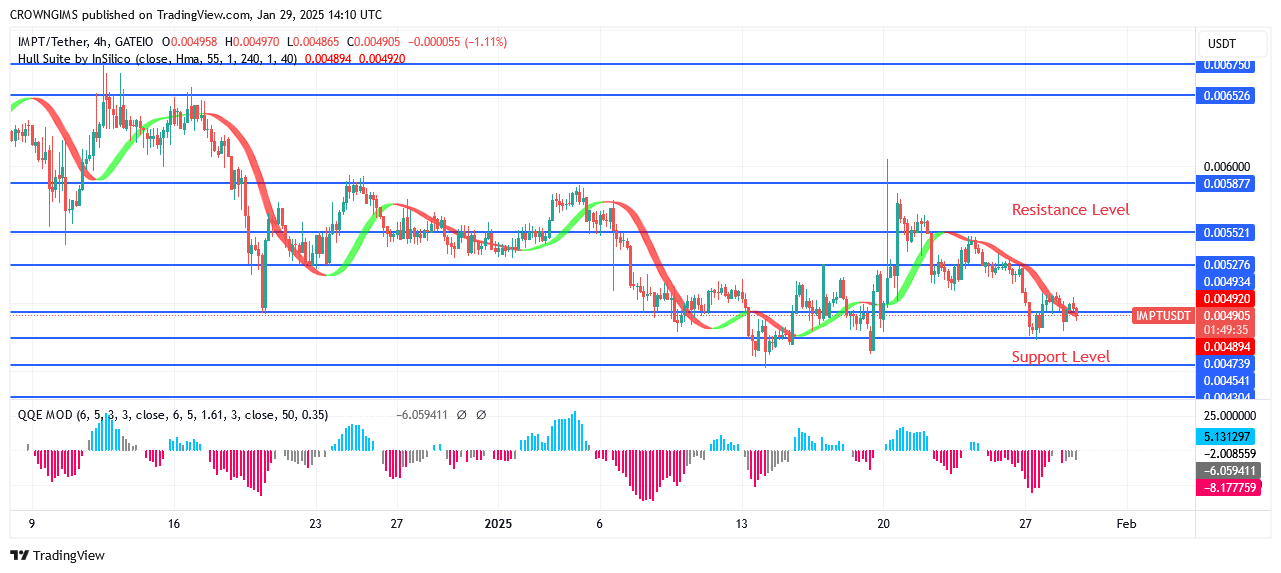
The price is trading below the Hull suite crypto signal, suggesting that sellers are in charge. The QQE MOD indicates a sell signal when it falls below the zero threshold.
Buy IMPT token on Exchanges!: IMPT (IMPT)
Happy International Day to Reduce CO2 Emissions!
📷 Happy International CO2 Emissions Reduction Day!
CO2 might be out there trying to steal the show, but IMPT has your back:📷 Carbon-neutral hotels.
📷 Automatic offsets.
📷 Big impact, zero extra effort.
📷 Because saving the planet doesn’t have to be boring—or hard. 📷— IMPT.io (@IMPT_token) January 28, 2025