Bancor (BNTUSD) Poses Bearish Rejection Candlestick Pattern on the Daily Chart
Don’t invest unless you’re prepared to lose all the money you invest. This is a high-risk investment and you are unlikely to be protected if something goes wrong. Take 2 minutes to learn more
Bancor Market Analysis – BNT Conforms to Bearish Rejection Candlestick Pattern Formation
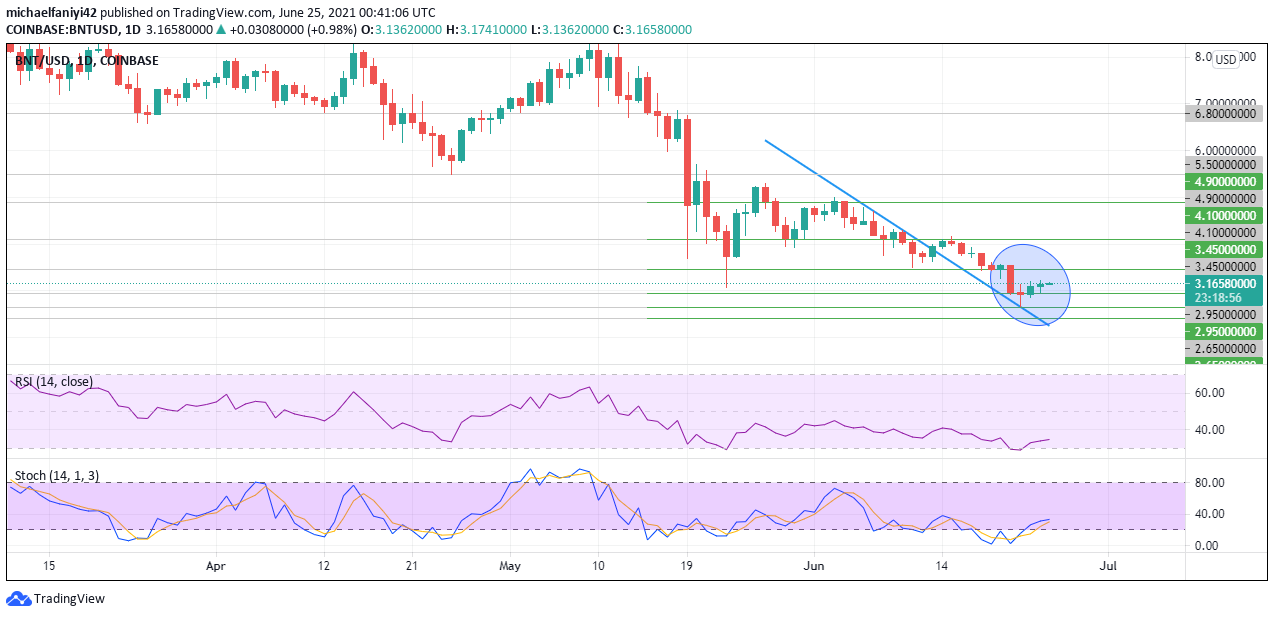
Bancor has posed a bearish rejection candlestick pattern on the daily chart to signal a change in market direction. BNT has been falling continuously since it plummeted on the 19th of May 2021. It presented a big bearish Haramis candlestick with a long lower wick. The price has been rejected at $6.800 to find support near $3.450.
The market tried to recover but was knocked back before it got to $5.500 resistance. Afterward, the market just slid down under bearish pressure along a descending trend line. Bancor, still under the sellers’ control, broke to the upside of the descending trend line on June 13, 2021. As it slid down, it posed with small candles, including the Doji and the hanging man candlesticks. This shows indecision on specific days in the market.
Bancor then dropped from the $3.500 key level to the $2.950 key level with a big bearish Marabuzo candlestick on the 21st of June 2021. The market then displayed a spinning top candlestick with a long wick, which reached the support level of $2.650 the following day, on the 22nd. This shows sellers’ exhaustion and following it immediately is a small bullish Haramis candlestick on the 23rd. The market also closed yesterday with a bullish spinning top and has opened today, also with a bullish candlestick.
The market has formed a Morning Star candlestick pattern, which signifies a market reversal. The RSI (Relative Strength Index) signal line has just bounced off the 30 mark just above the oversold region and it is gently ascending. The Stochastic oscillator has also steadily risen out of the oversold region. Both indicators present a large scope for upwards momentum.
BNTUSD Significant Zones
Resistance Zones: $4.900, $4.100, $3.450
Support Zones: $2.950, $2.650, $2.400

Bancor Market Expectation

A hanging man candlestick had followed the Marabuzo candlestick on the 4-hour chart, propelling the price upwards. The RSI indicator is currently at 48.80 and moving upwards. The Stochastic signal lines have entered the overbought region and the market may pull back before continuing its ascent.
BNT is on the ascent after bouncing off $2.650. The market is expected to reach the key level of $4.100.
You can purchase crypto coins here. Buy Tokens
Note: Cryptosignal.org is not a financial advisor. Do your research before investing your funds in any financial asset or presented product or event. We are not responsible for your investing results.