Bancor (BNTUSD) Recovers From Price Slump and Is Set to Keep Growing
Estimated Reading Time: 2 minutes
Don’t invest unless you’re prepared to lose all the money you invest. This is a high-risk investment and you are unlikely to be protected if something goes wrong. Take 2 minutes to learn more
BNTUSD Key Zones
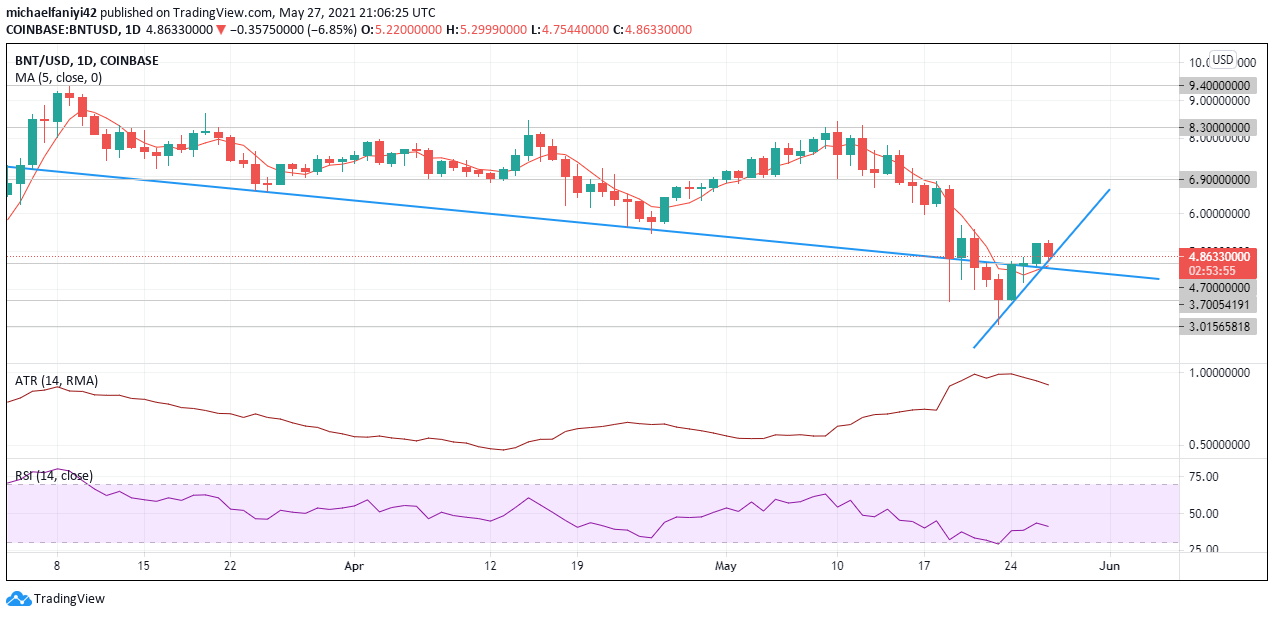
Demand Zones: $9.40, $8.30, $6.90
Supply Zones: $4.70, $3.70, $3.01
BNTUSD Market Analysis
Bancor experienced a sharp drop in price as it slumped past the $4.70 support on the 19th of May 2021. Price had been on a weekly downward trend. It was expected that the descending trend line would hold up the market, but the price soon surged past the trend line, past the $4.70 and $3.70 supports till it touched down on the $3.01 support.
The bulls took over from there and are set to effect a correction in the market price. A bullish engulfment has ensured that Bancor has been taken back into the path of the trend line. The coin is expected to keep ascending in compliance with the weekly trend line. The price is expected to get to the $6.90 resistance. BNT is currently showing a bearish candle with wicks below and above. 
BNTUSD Price Anticipation
The initial surge past the weekly trend line was empowered by a sudden increase in market volatility. The ATR (Average True Range) indicator moved from 0.739 to 0.912, in what is a 23.41% increase in volatility in the space of one day.
The 5MA (Moving Average) has made a U-turn and is looking upwards to show a change in market direction. The RSI (Relative Strength Index) has its signal line at 42.91 but is slightly looking down due to the current retracement in price.
On the 4-hour chart, the volatility currently has decreased considerably from that which caused the price to initially surge downwards. The ATR is currently at 0.295. This is so, reflecting that price has returned to the descending trend line and is now moving as its wavelength
The 5MA is on the ascendency signifying general bullish activity. The RSI signal line, though generally bullish, has faced down. This is due to the current bearish candle formed.
Note: new.cryptosignals.org is not a financial advisor. Do your research before investing your funds in any financial asset or presented product or event. We are not responsible for your investing results.