Band Protocol (BANDUSD) Is Cranking Between $9.450 and $6.100 Key Levels
Estimated Reading Time: 3 minutes
Don’t invest unless you’re prepared to lose all the money you invest. This is a high-risk investment and you are unlikely to be protected if something goes wrong. Take 2 minutes to learn more
Market Analysis – BANDUSD Has Been Confined to Cranking Between Key Levels
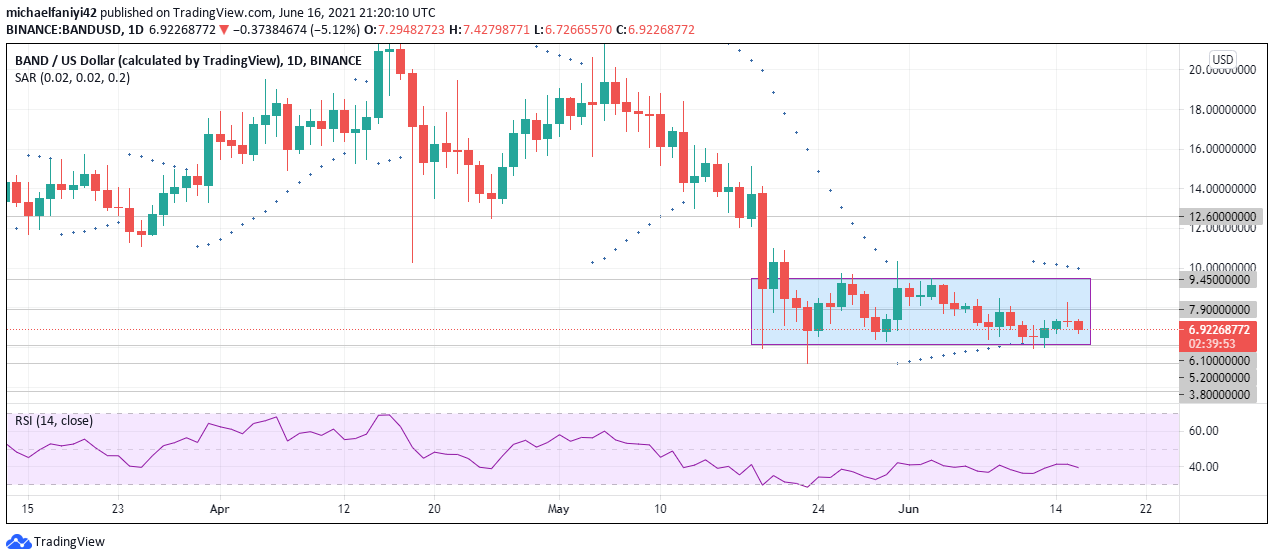
BANDUSD is currently cranking between $9.450 and $6.100 Key Levels. This comes after the market had fallen spectacularly following a double top reversal pattern.
The double top reversal pattern was formed from the 25th of March 2021 to the 18th of May 2021. Then on the 19th of May, the market fell directly from the double top neckline at $12.600 to the $6.100 support. Buyers immediately tried to lift the market, they overcame the resistance at $9.450, but soon fell back below it.
With $6.100 as support, the BANDUSD has tried the $9.450 resistance twice without success, each time falling back around the $6.100 key level. The market, therefore, depicts BANDUSD as cranking between the $9.450 and $6.100 Key Levels. The market also has been very sensitive to the $7.900 key level, as it acts as support/resistance in-between the range. The Band Protocol has failed to go beyond $7.900 in the last two trials and has fallen back to $6.100 each time, thereby forming a mini cranking pattern within the major range.

BANDUSD Key Levels
Resistance Zones: $12.600, $9.450, $7.900
Supply Zones: $6.100, $5.200, $3.800
The market is currently displaying an evening star candlestick pattern which is a bearish reversal pattern having bounced back from the $7.900 resistance. The Parabolic SAR (Stop and Reverse) confirms that the market is currently on a descent. It is currently displaying 5 dots above the daily candlesticks.
The RSI (Relative Strength Index) indicator has been moving in a wavy manner to show the cranking movement of the market. Its signal line is at 39.75 and facing downward to show a bearish activity.

What to Expect From BANDUSD Cranking Movement

On the 4-hour chart, the market is currently falling from the $7.900 resistance towards the $6.100 support. The Parabolic SAR on the 4-hour chart agrees with that of the daily chart. It has 7 dots above the candlesticks showing current bearish movement. The RSI is currently at 45.21 and moving downwards.
BANDUSD is expected to continue in its cranking movement by falling to the $6.100 support before turning back upwards to $7.900 and with persistence reach for $9.450.
Note: Cryptosignal.org is not a financial advisor. Do your research before investing your funds in any financial asset or presented product or event. We are not responsible for your investing results.