Bitcoin (BTC) Price Prediction: BTC/USDT Stays Downwind
Estimated Reading Time: 2 minutes
Don’t invest unless you’re prepared to lose all the money you invest. This is a high-risk investment and you are unlikely to be protected if something goes wrong. Take 2 minutes to learn more

Date: February 4, 2026
The Bitcoin market was hit by strong headwinds, which sent its price action sharply lower. The token even tested a long-term support level at $75,000 before rebounding slightly above it.
BTC/USDT Long-Term Trend — Bearish (Daily Chart)
Key Price Levels
Resistance: $77,000, $80,000, $82,500
Support: $75,000, $72,500, $70,000
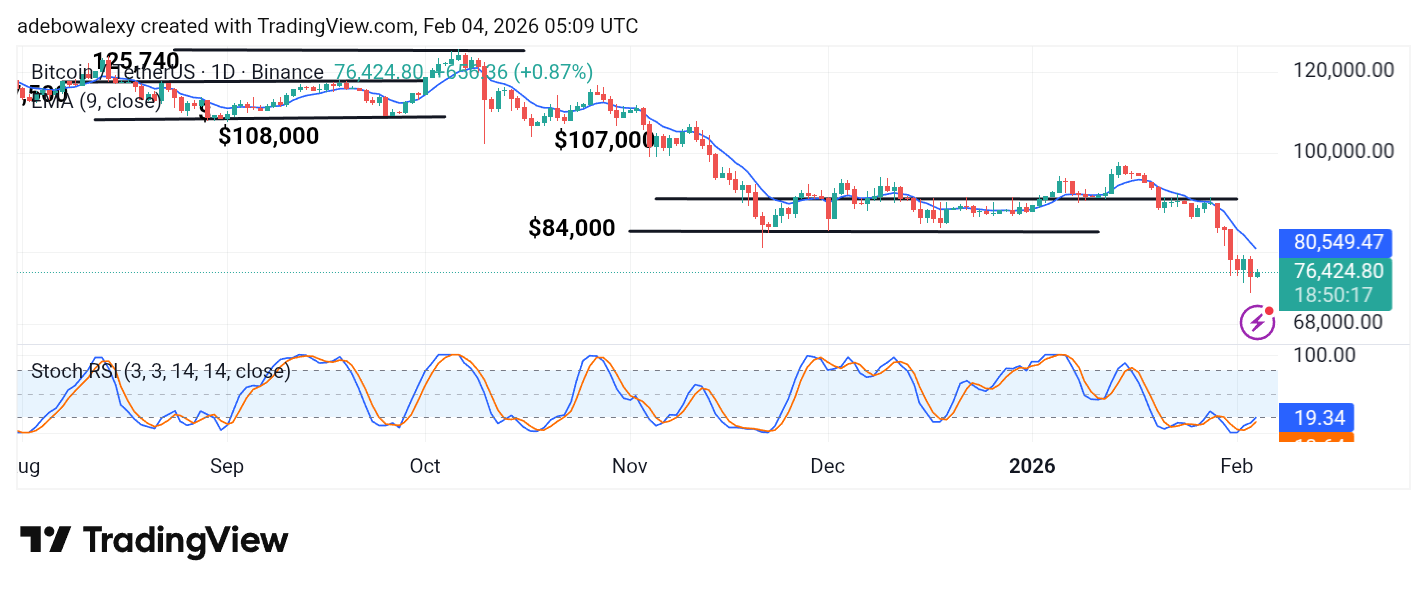
Price action in the Bitcoin market has been spiraling downward following hawkish comments from the U.S. president. As a result, the ongoing session has slipped below the 9-day Exponential Moving Average (EMA).
The most recent price candle on the chart is green but remains below the 9-day EMA curve. Consequently, the Stochastic Relative Strength Index (SRSI) indicator lines are in the oversold region, though they show a slight upward trajectory.
Bitcoin Price Prediction: BTC/USDT Remains Subdued and May See Further Bearish Progress
On the daily chart, price action continues to follow a downward trajectory, with the market diving toward lower price levels. The decline appears steep, reinforcing bearish sentiment.
As a result, price action remains below the 9-day EMA curve, which presents a strong bearish outlook for the market. Meanwhile, the SRSI indicator lines are attempting a modest upward move from the oversold region. Consequently, the market remains under significant bearish pressure.
Bitcoin Price Prediction: BTC/USDT Yielding to Bearish Pressure (4-Hour Chart)
While the Bitcoin market managed to register a short-term recovery over the past two sessions, the ongoing session is currently represented by a red price candle.
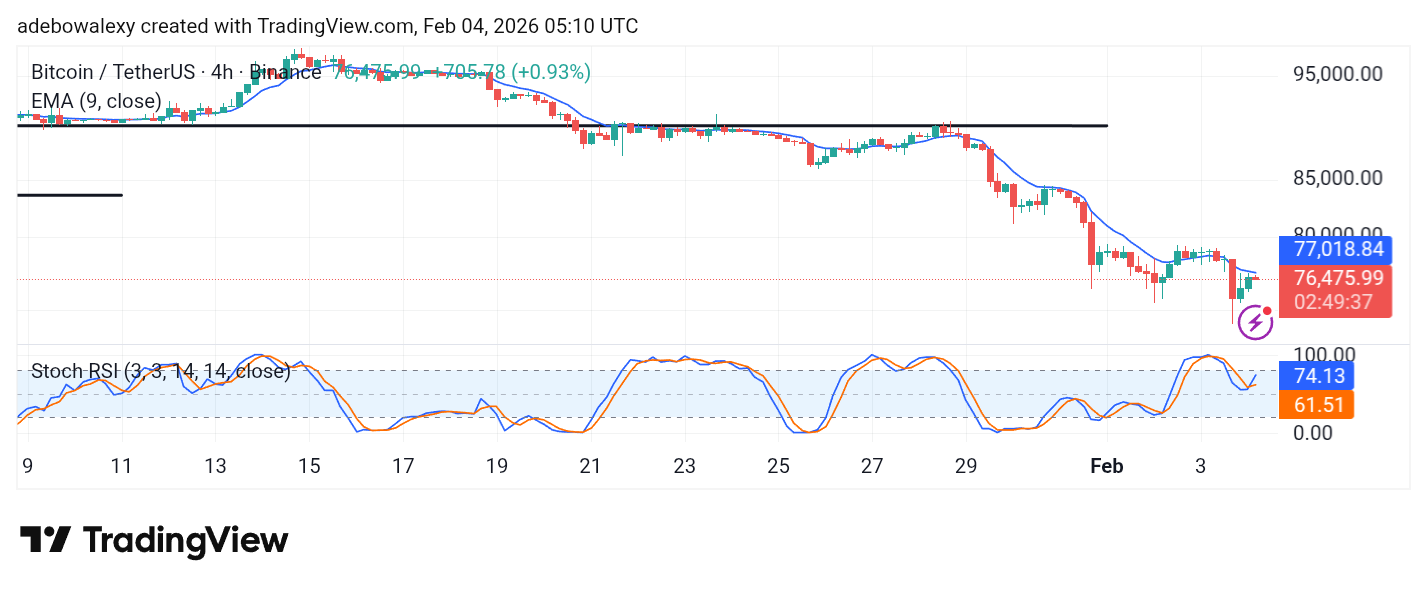
Moreover, this weakness is occurring below the 9-day EMA curve. The SRSI indicator lines have delivered an upside crossover, and despite the minor downward pullback, they continue to maintain an upward trajectory. Be that as it may, support at the $75,000 level may be tested again shortly.