Bitcoin (BTC/USD) Market Features in Wide Range-Bound Zones
Estimated Reading Time: 3 minutes
Don’t invest unless you’re prepared to lose all the money you invest. This is a high-risk investment and you are unlikely to be protected if something goes wrong. Take 2 minutes to learn more

Free Crypto Signals Channel
Bitcoin Price Prediction – August 3
There have been ups and downs in the BTC/USD trade operations over several days as the crypto market features in wide range-bound zones of $20,000 and $25,000. Price in the last few hours of today’s session has witnessed a low and a high of $22,711 and $23,090 as the price keeps a negative percent of 0.79 minutely.
BTC/USD Market
Key Levels:
Resistance levels: $25,000, $27,500, $30,000
Support levels: $20,000, $17,500, $15,000
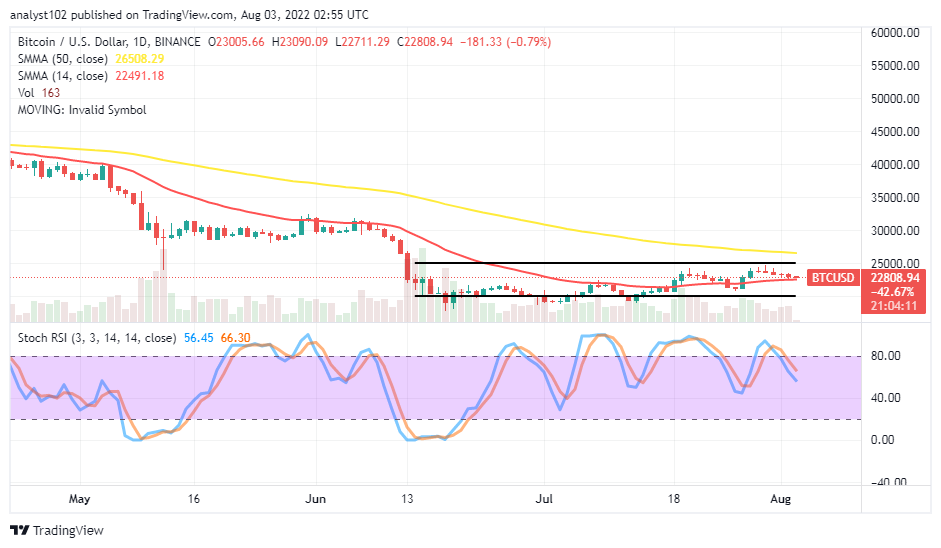
BTC/USD – Daily Chart
The BTC/USD daily chart reveals the crypto-economic market features in wide range-bound zones, embodying a series of ups and downs within. The 14-day SMA indicator is in the range-bound space at $22,491.18 below the 50-day SMA indicator, which is at $26,508.29. The Stochastic Oscillators relatively swerved toward the southbound direction. And they have reached a range of 55, pointing to the downside.
Will the BTC/USD market still push further to the downside?
The BTC/USD market bears have to push southward in a correctional-moving mode as the crypto market features in wide range-bound zones. It would be psychological to suspend buying actions until a bullish candlestick occurs around the trend line of the 14-day SMA. The current trading situation portends that forces to the downside are coming forth with a less-active motion.
On the downside of the technical analysis, the declining forces are not worthy for the BTC/USD market sellers to join based on the reason of being lesser active. It would be technically ideal that new selling order executions are on hold for a while. Variant smaller bearish candlesticks are seemingly approaching a point of exhaustion. All in all, traders needed to be wary of exerting new orders at this point. However, it could be one of the ideal moments for investors to join the market.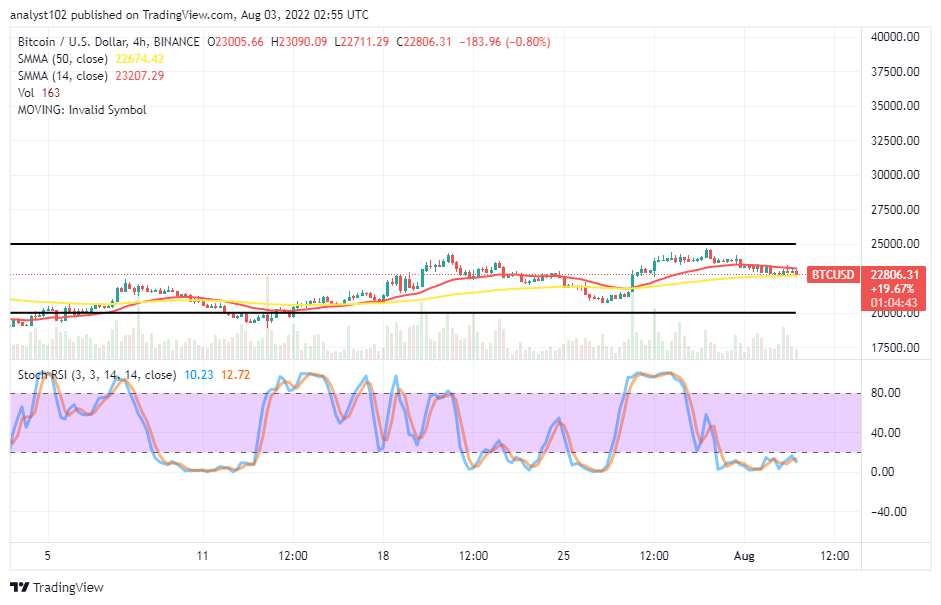
BTC/USD 4-hour Chart
The BTC/USD medium-term chart shows the crypto market features in wide range-bound zones between $20,000 and $25,000. The 14-day SMA indicator is closely above the 50-day SMA indicator with the range-bound value lines. The Stochastic Oscillators are in the oversold region, moving in a consolidation manner. And the trading candlesticks suggest price may still force downward if bulls are eventually too weak to spring upward from the trend line of the 50-day SMA, which is at $22,674.42.
Note: Cryptosignals.org is not a financial advisor. Do your research before investing your funds in any financial asset or presented product or event. We are not responsible for your investing results.
You can purchase Lucky Block here. Buy LBLOCK