Bitcoin (BTC/USD) Price Downsizes Toward $20,000
Estimated Reading Time: 3 minutes
Don’t invest unless you’re prepared to lose all the money you invest. This is a high-risk investment and you are unlikely to be protected if something goes wrong. Take 2 minutes to learn more


Free Crypto Signals Channel
Bitcoin Price Prediction – July 27
The BTC/USD market price downsizes toward the $20,000 critical support line. As of writing, the crypto market trades around $21,122. Price possesses a minimal percentage rate of 0.66 negative.
BTC/USD Market
Key Levels:
Resistance levels: $22,500, $25,000, $27,500
Support levels: $20,000, $17,500, $15,000
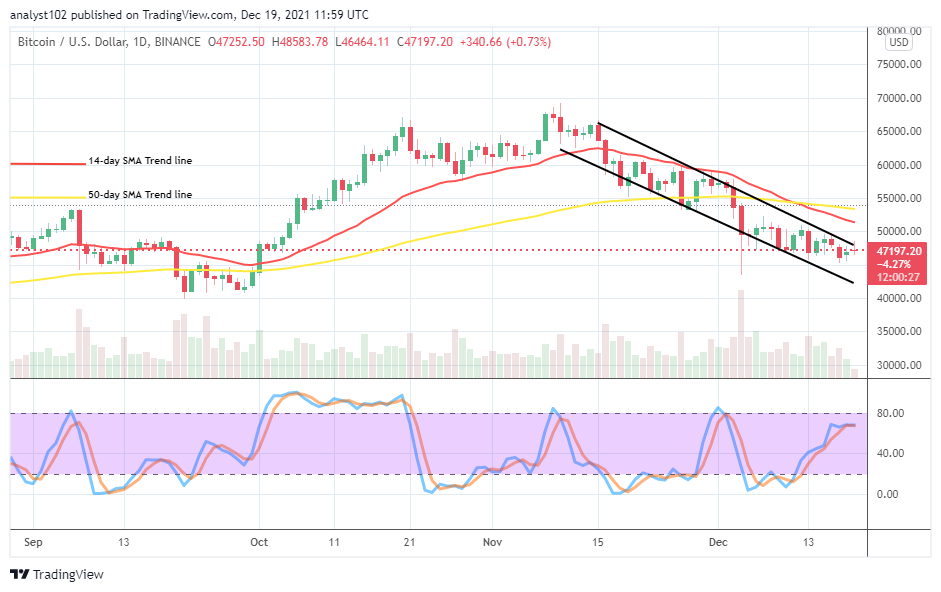
BTC/USD – Daily Chart
The BTC/USD daily chart showcases the crypto-economic price downsizes toward the $20,000 support level, following its inability to push more through the variant resistances above the $22,500 level in last operations over the trend line of the smaller SMA. The 50-day SMA indicator is over the 14-day SMA indicator as they have given positional points of $26,947.42 and $21,785.17. The Stochastic Oscillators have crossed southbound from the overbought region, seemingly striving to reach for touch around the 20 range point.
Should traders follow the BTC/USD market down to the $20,000 psychological support line?
The BTC/USD market has had it that the crypto-economic price downsizes toward the $20,000 critical support level. Although, the falling force that backs the trend to the downside is feeble currently. As a result, traders may have to stay off from trading for a while. Long-position placers may get resettled around the value line to rebuild support stances from or around the value line after some time.
On the downside of the technical analysis, the BTC/USD market bears will have to intensify pressures on the $20,000 pivotal support level to affirm a continuation of the downward-trending motion afterward. If the price should push for a touch or a test of the value line, a rallying move is bound to occur that will allow the crypto market to move back into a recovery movement.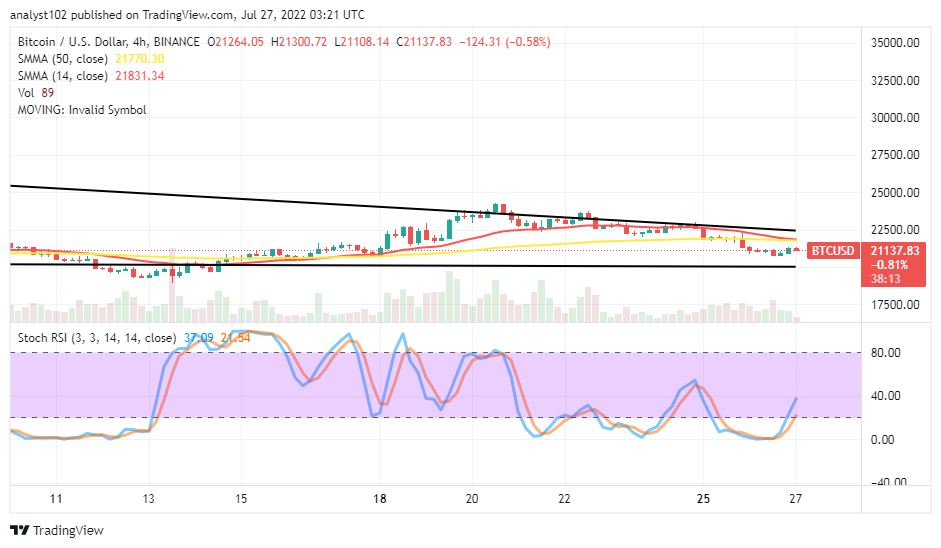 BTC/USD 4-hour Chart
The BTC/USD medium-term chart shows the crypto-economic price downsizes toward the $20,000 baseline support level. The 14-day SMA indicator is closely bent southward at $21,831.34 above the 50-day SMA indicator, which is at $21,770.30. A Series of candlesticks have emerged around the bearish trend line drawn to denote the correctional path of the crypto deal. The Stochastic Oscillators have managed to cross northbound from an area of the oversold region. And they are close to the 40 range. Traders needed to be cautious of their activities around the support line.
Note: Cryptosignals.org is not a financial advisor. Do your research before investing your funds in any financial asset or presented product or event. We are not responsible for your investing results.
You can purchase Lucky Block here. Buy LBLOCK