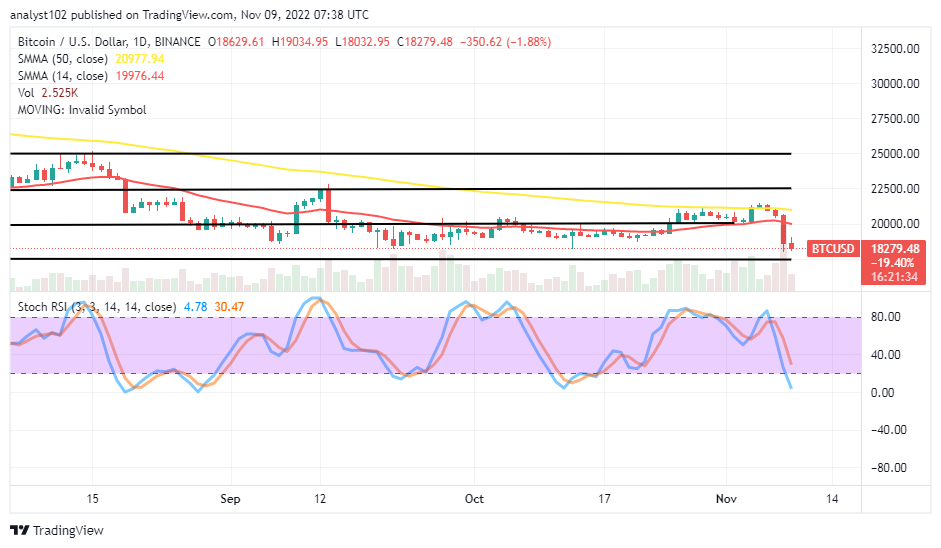
Exploring Cryptocurrency Trends: Navigating the World of Digital Assets
Estimated Reading Time: 5 minutes
Don’t invest unless you’re prepared to lose all the money you invest. This is a high-risk investment and you are unlikely to be protected if something goes wrong. Take 2 minutes to learn more

In the ever-fluctuating realm of cryptocurrency, strategic foresight is the linchpin that separates triumph from defeat. Despite the tumultuous nature of coins like Bitcoin and Ethereum, which often confound traders with their capricious price swings, astute market maneuvers and well-informed investments can yield substantial returns. Central to this approach is technical analysis, empowering investors to swiftly discern patterns and make informed decisions.
But how does one engage in technical analysis, and to what extent does it influence portfolio performance?
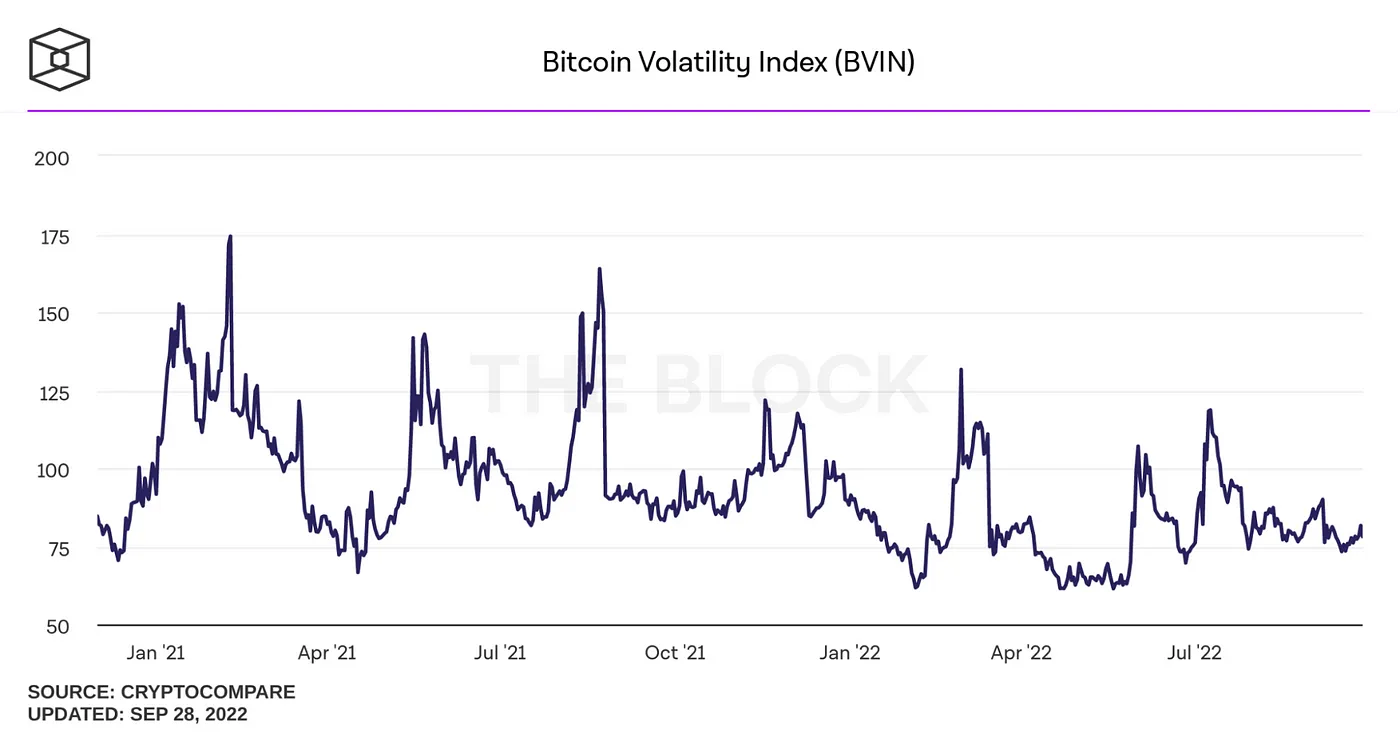
Bitcoin’s Volatility Index (BVIN) vividly illustrates the asset’s susceptibility to dramatic price fluctuations, surpassing those of traditional stocks and shares by multiples. While comprehending these rapid oscillations may pose a challenge, technical analysis serves as a beacon, aiding investors in recognizing impending movements.
With this in consideration, let’s delve into how investors can leverage technical analysis to delve deeper into cryptocurrency performance, facilitating the identification and anticipation of future trends.
Factors Influencing Cryptocurrency Prices
Before dissecting the technical indicators pertinent to cryptocurrencies, it’s imperative to grasp the myriad factors influencing asset prices and performance.
Supply and demand stand as paramount considerations for investors. Bitcoin, for instance, is programmed with a finite circulation of 21 million coins, with approximately 19.1 million currently in circulation. Moreover, Bitcoin’s issuance to miners undergoes a halving every four years, rendering it increasingly scarce over time.
Diverse coins boast varying issuance limits, if any. Consequently, assessing supply is pivotal, as a higher circulation typically correlates with a lower asset value. Assets with high circulation necessitate substantial trading volumes to instigate meaningful price surges.
Furthermore, investors must factor in the myriad applications and underlying projects of cryptocurrencies, along with technological developments, all of which can significantly impact price rallies. For instance, Ethereum experienced a recent price fluctuation following its merger event.
Regulatory shifts can also exert substantial influence on asset prices. Bitcoin, for instance, faced adversity following bans in China, while XRP weathered extreme price volatility following the SEC’s 2020 lawsuit.
While deciphering the factors influencing cryptocurrency prices may prove daunting, astute analysis enables investors to discern trends and anticipate future movements effectively.
Understanding Primary, Secondary, and Tertiary Trends in Cryptocurrency Markets
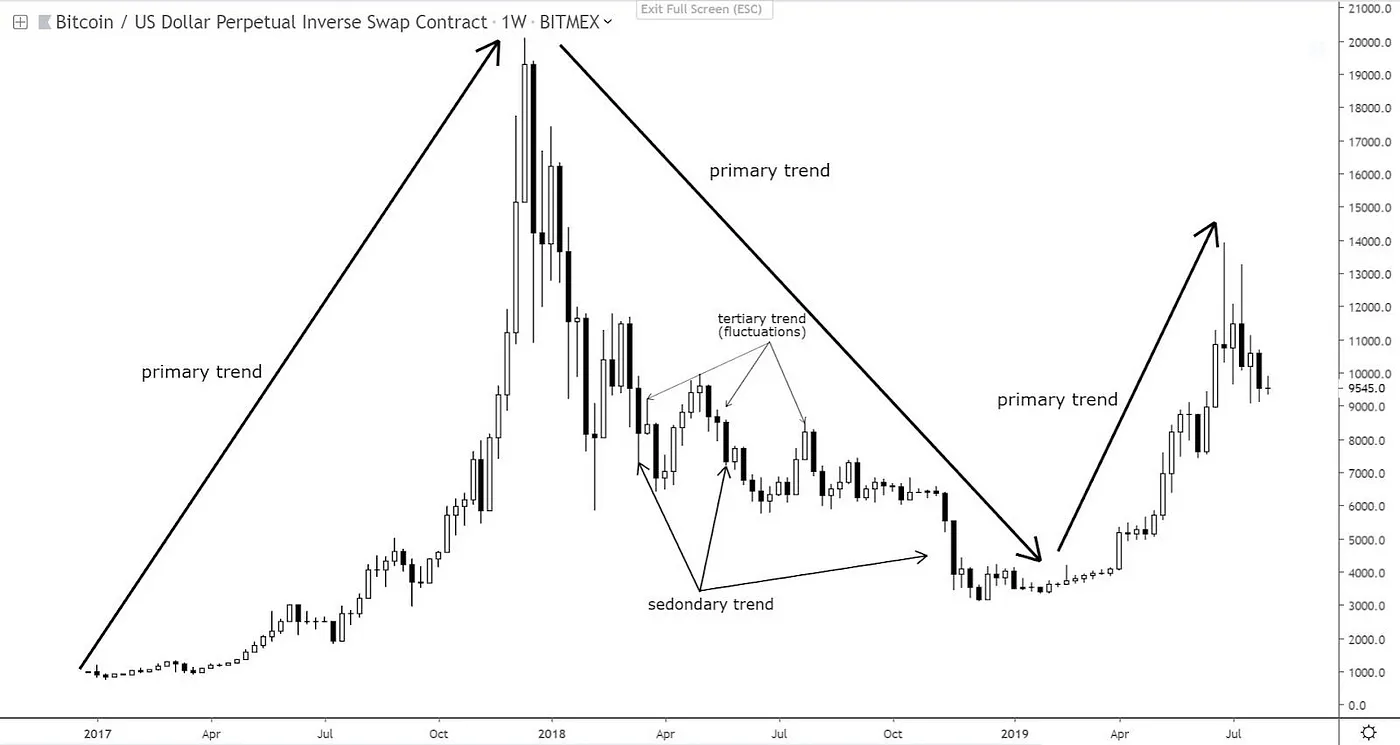
Per Dow’s theory, markets, including the cryptocurrency market, exhibit three types of trends. Primary trends denote significant market movements lasting months or years, while secondary trends can counter primary ones, indicating pullbacks within bull markets or temporary opposing movements.
Investors should also consider tertiary trends, fleeting movements lasting about a week. These are often viewed as market noise and are disregarded by long-term investors.
Primary trends, such as bull and bear markets, warrant the highest respect from investors, while secondary trends offer opportunities for short-term gains by going against the trend strategically.
Primary trends typically unfold in three phases, presenting opportunities for investors. The first phase involves accumulation in bull markets or distribution in bear markets, signaling a shift in market sentiment and allowing early anticipation of price movements.
The second phase sees broader market participation as price movements gain momentum, followed by the excess phase in bull markets and the panic phase in bear markets, where investors speculate on movements as the phase nears its end. Being proactive during these phases can lead to advantageous positions ahead of the wider market.
Utilizing Data for Informed Predictions
Investors can leverage this data to gain insights into crypto assets, identify support and resistance levels, and indicate price bottoms or peaks.
Identifying resistance levels allows investors to use stop-loss orders to mitigate losses if the asset falls below these levels, preventing significant losses.
Various tools like the Average Directional Index, Bollinger Bands, Relative Strength Index (RSI), or standard deviation can aid traders in making informed decisions.
Additionally, utilizing chart templates from platforms like PoweredTemplate can transform raw data into actionable insights or facilitate collaboration with peers.
Despite the crypto market’s volatility, strong technical analysis enables investors to identify trends swiftly and respond to price movements promptly. Monitoring candlestick patterns, identifying primary trend phases, and investing responsibly contribute to building a robust portfolio.