Polygon Price Prediction: MATIC Buyers Tread Carefully Upwards
Estimated Reading Time: 3 minutes
Don’t invest unless you’re prepared to lose all the money you invest. This is a high-risk investment and you are unlikely to be protected if something goes wrong. Take 2 minutes to learn more
Polygon (MATIC) Price Prediction: May 5
Studying recent price movements in the Polygon market reveals that since buyers made their last stand at the $0.6779 price level. As a result, the market has maintained an upward trajectory since four sessions ago. Let’s further analyze the trend for better understanding.
MATIC/USDT Long-term Trend: Bullish (Daily Chart)
Key Levels:
Resistance Levels: $0.900, $1.200, and $1.500
Support Levels: $0.700, $0.500, and $0.200
MATIC/USDT: Daily Chart
Polygon Price Prediction: MATIC/USDT Heads Towards the $1.00 Mark
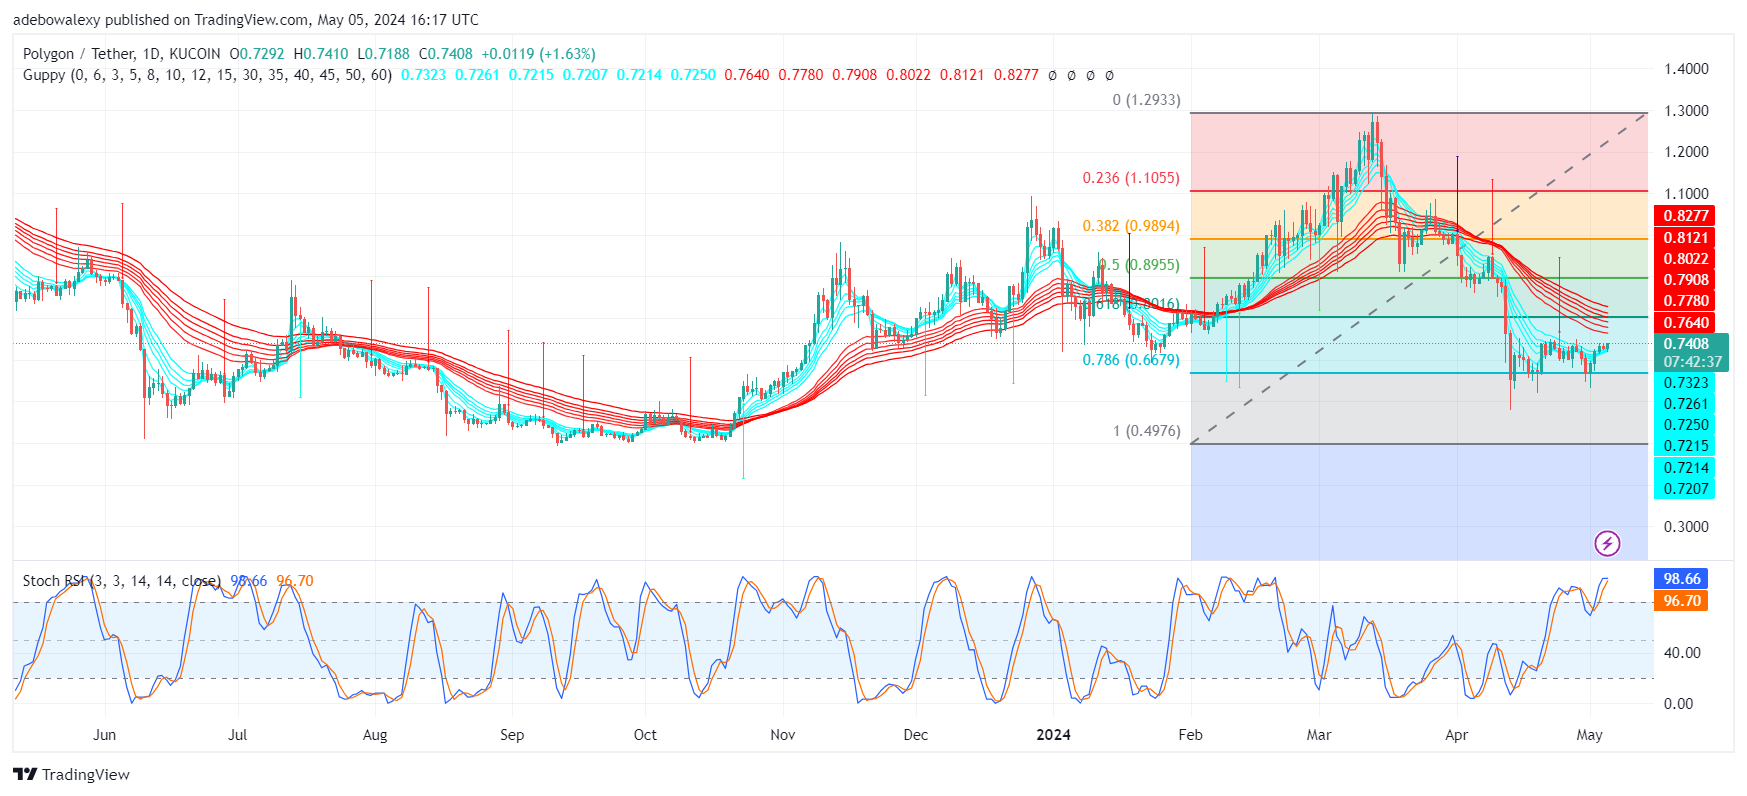
As mentioned, price action in the Polygon daily market has rebounded from the $0.6779 mark. This price level aligns with the 78.60 Fibonacci level. Since then, the market has been gradually retracing higher marks. The ongoing session has placed the token above the green Guppy Multiple Moving Average (GMMA) curves. At the same time, the Stochastic Relative Strength Index (SRSI) lines have reached the overbought region. However, it should be noted that the leading line of the SRSI indicator is already bending sideways, suggesting a possible trend reversal.
Polygon Price Prediction: What Can Be Expected From MATIC/USDT Market?
Looking at the daily chart, it is evident that volatility is quite low. Nevertheless, the market is making its way steadily upward on a minimal scale. The last price candle can be seen placing the token’s price above the green GMMA line. Likewise, the appearance of the last price candle lacks a vivid upper shadow, indicating that upside forces are actively propelling the market.
However, the SRSI indicator lines have reached the overbought region, but the sideways trajectory of the leading SRSI line suggests a possible trend reversal. This will keep the market ranging between $0.7500 and $0.6779 price levels. On the contrary, if upside forces can sustain the trend, the market may head further upward toward the $0.8000 mark.
MATIC/USDT Medium-term Trend: Uptrend Continues With Volatility Decline (4H Chart)
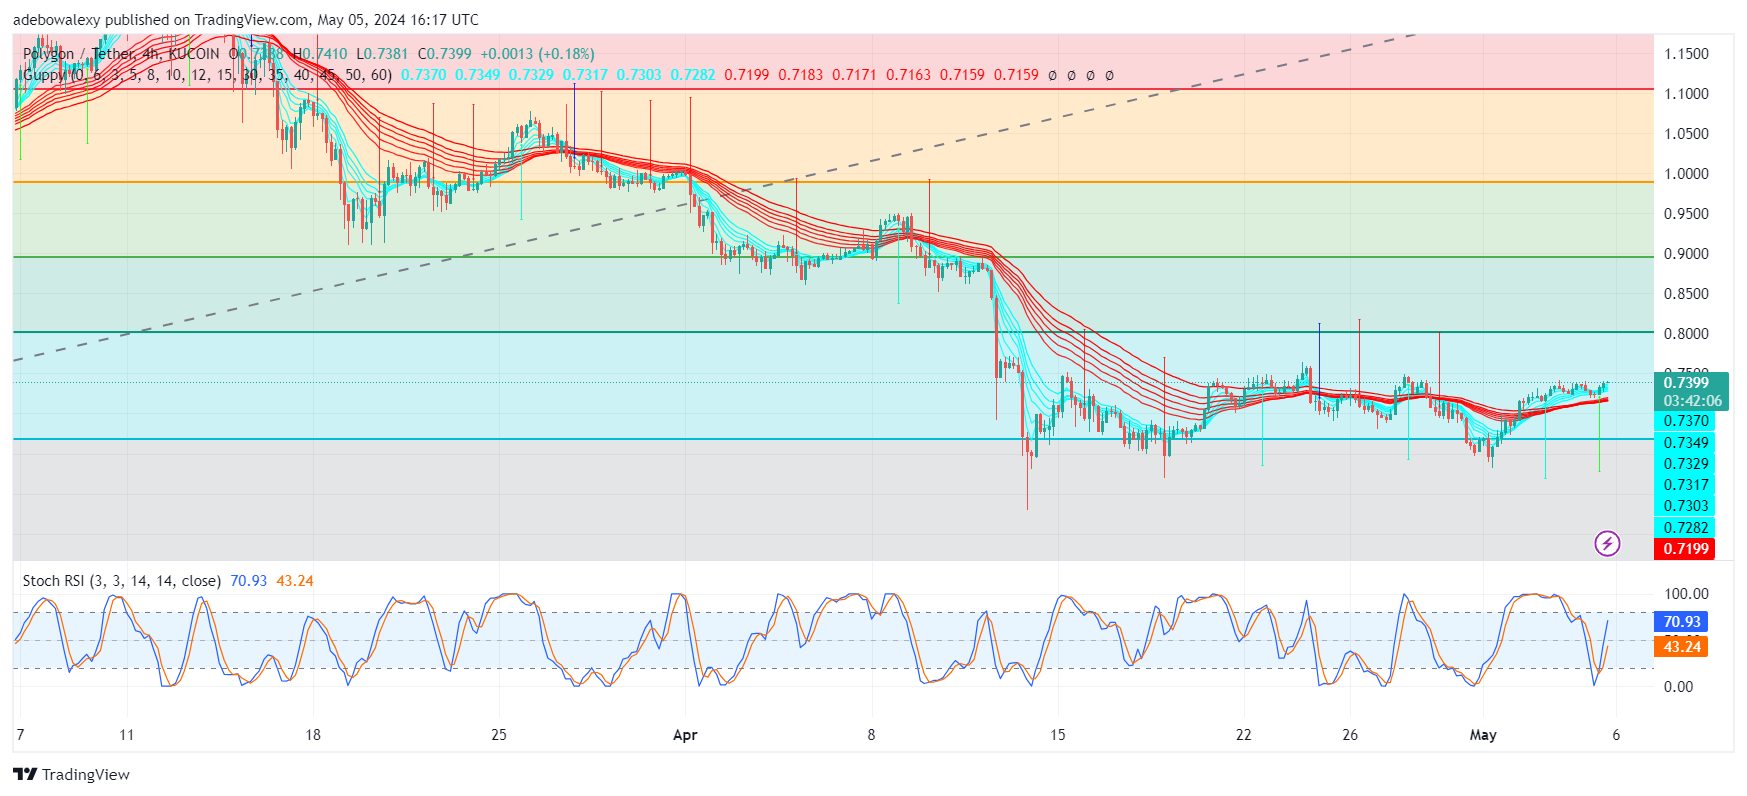
Even on the 4-hour Polygon market chart, we can see that the uptrend continues. Over the past two sessions, price activity has moved across the green GMMA lines. The ongoing session has seen reduced volatility, but it still appears above the green GMMA lines. Consequently, this keeps the market headed toward the $0.7500 mark (a psychological price level). Meanwhile, the movement of the SRSI indicator lines seems exaggerated in its upside path.
4-Hour Chart
Considering the prevailing trend, one can assume that the market maintains an upward trajectory, which seems favorable for the uptrend. However, the exaggerated movement of the SRSI indicator lines raises concerns about the health of the trend. Consequently, this suggests that the uptrend may continue towards the $0.800 mark, but traders may want to tread with caution.