Solana (SOL/USD) Price Hovers at $30
Estimated Reading Time: 3 minutes
Don’t invest unless you’re prepared to lose all the money you invest. This is a high-risk investment and you are unlikely to be protected if something goes wrong. Take 2 minutes to learn more
Solana Price Prediction – October 28
The SOL/USD market price hovers at the $30 trading line as the crypto economy trades around $30.61, and the percentage rate at which the market features is at a minute 0.10 positive.
SOL/USD Market
Key Levels:
Resistance levels: $30, $35, $40
Support levels: $25, $20, $15
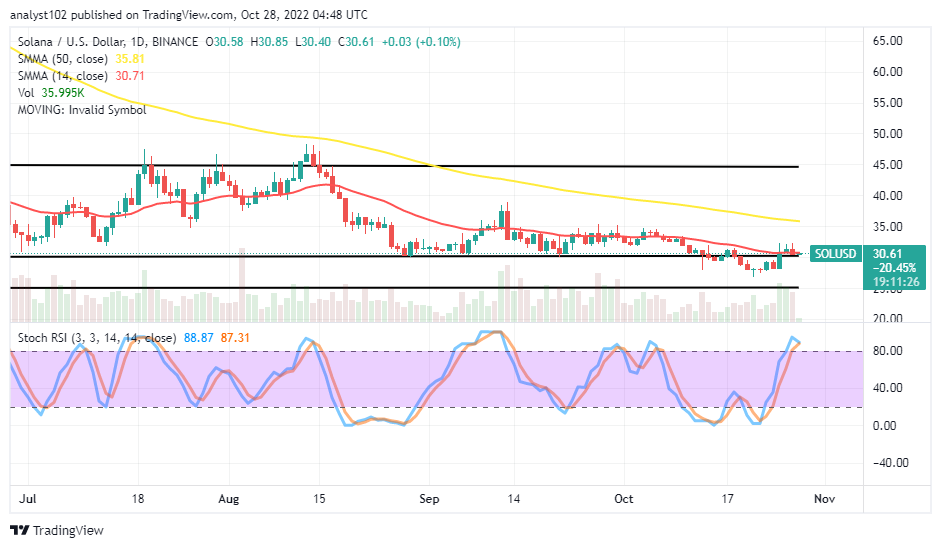
SOL/USD – Daily Chart
The SOL/USD daily chart reveals the crypto market price hovers at the $30 resistance level. The trending outlook of the SMAs portends that the market is in a bearish trend as the 14-day SMA indicator is at $30.71, underneath the $35.81 value line of the 50-day SMA indicator. The Stochastic Oscillators have deepened into the overbought region at 87.31 and 88.87 range values. Variant trading candlesticks that show around the smaller SMA signal the possibility of buyers losing the energy to the downside in no time.
Will the SOL/USD market lose its stance in the southward direction?
The SOL/USD market may lose its stance as the transaction dealings of the US Dollar have made the price hovers at the $30 resistance trading spot over time. A setup on the formation of candlesticks that featured around the value line suggests that buyers need to wait for a necessary correction to re-occur closely or around a lower-trading spot of the $25 support level before staging a new round of buying orders.
On the downside of the technical analysis, some barriers are garnering near over the trend line of the 14-day SMA indicator. It appears that much may not be achieved following the trend to the upside direction at its current trading capacity. A bearish candlestick will have to emanate from a false pull from the zone and in the wake of resuming a declining motion; sellers can then join the presumed move in time.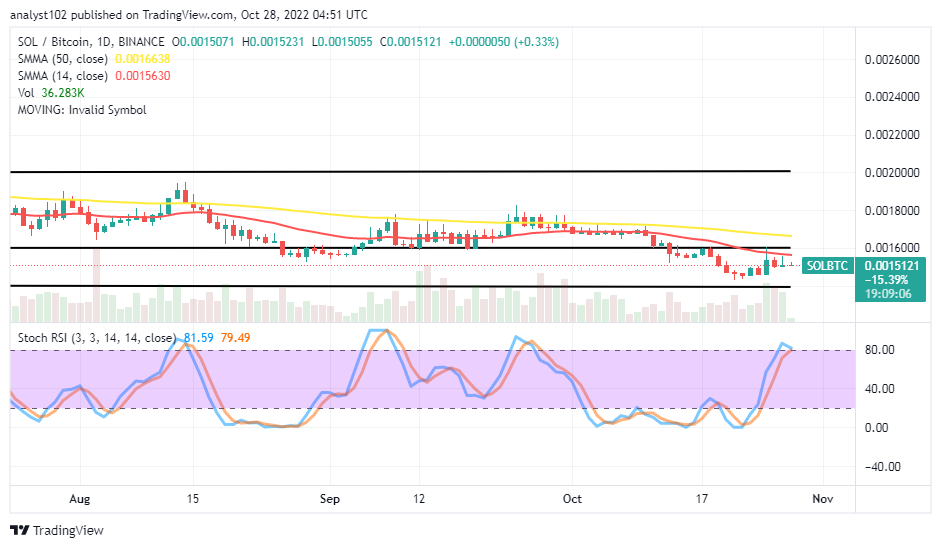
SOL/BTC Price Analysis
Solana has dumped below the trend lines of the SMAs against the pushing ability of Bitcoin over some days. The pairing cryptocurrency price hovers within the smaller lower range-bound zones. The 14-day SMA indicator is underneath the 50-day SMA indicator. The Stochastic Oscillators have moved upward, briefly breaking past the range of 80 into the overbought region, maintaining 79.49 and 81.59 range values. It shows the base crypto may return into a downward-trending move as it pairs with its counter crypto.
Note: Cryptosignals.org is not a financial advisor. Do your research before investing your funds in any financial asset or presented product or event. We are not responsible for your investing results.
You can purchase Lucky Block here. Buy LBLOCK