XRP Falls to a Low of $0.56 as the Current Surge Is Speculative
Estimated Reading Time: 2 minutes
Don’t invest unless you’re prepared to lose all the money you invest. This is a high-risk investment and you are unlikely to be protected if something goes wrong. Take 2 minutes to learn more

XRP (XRP) Long-Term Analysis: Bearish
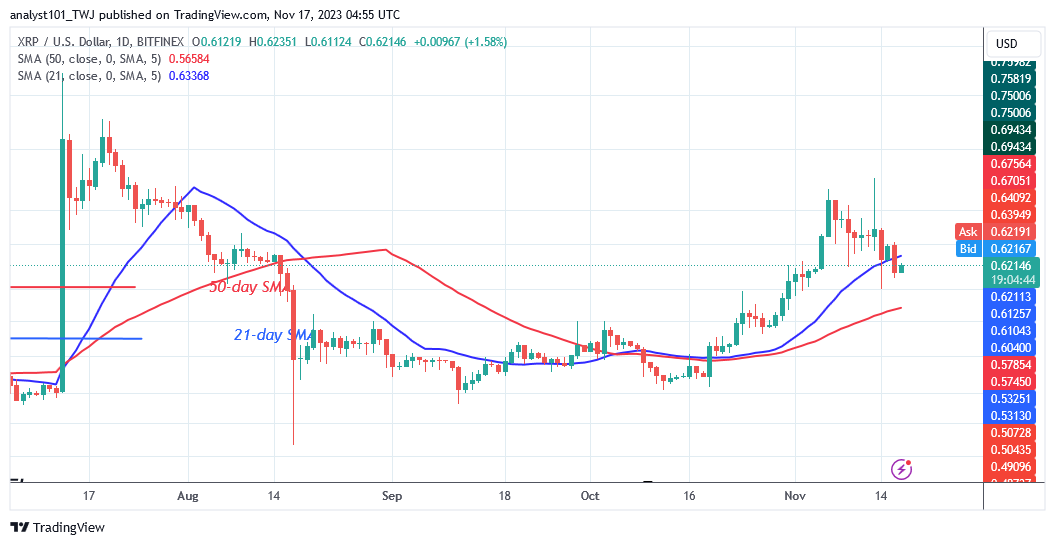
The price of XRP (XRP) has fallen to a low of $0.56 after two rejections from highs of $0.74 and $0.75. The altcoin was rejected during the rise of November 6. The upward trend could not be maintained by buyers above the resistance level of $0.74. XRP was rejected at a high of $0.73. On November 13, the coin’s price peaked at $0.75 before plummeting drastically above $0.64. The coin’s future upward trend is speculative.
At the time of writing, XRP/USD has plummeted to a low of $0.60. On the downside, the bears have broken through the 21-day simple moving average support. This suggests that bearish momentum will continue until the low above the 50-day SMA. This suggests a slide to a low of $0.56. Price turmoil will commence if the 50-day SMA support holds.
Technical Indicators:
Major Resistance Levels – $1.00, $1.50, $2.00
Major Support Levels – $0.50, $0.30, $0.10
XRP (XRP) Indicator Analysis
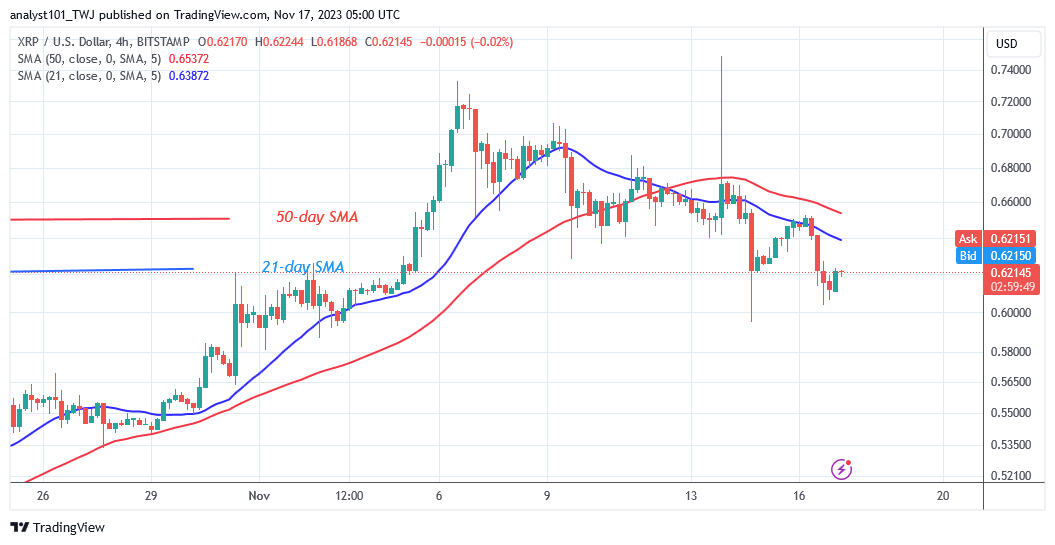
The altcoin’s price has begun to fall as it falls below the 21-day SMA. The coin is now trading above the 50-day simple moving average but below the 21-day simple moving average. The drop will extend to the 50-day SMA’s support. If the 50-day SMA support holds, the sideways movement will begin. If the bears violate the support level of the 50-day SMA, the selling pressure will continue.
What Is the Next Direction for XRP (XRP)?
The cryptocurrency asset will continue to fall until it reaches a low of $0.56. The decrease is currently caught between the moving average lines. The coin’s future trend will be determined by the price breaking through the moving average lines.
You can purchase crypto coins here. Buy LBLOCK
Note: Cryptosignals.org is not a financial advisor. Do your research before investing your funds in any financial asset or presented product or event. We are not responsible for your investing results