0x (ZRXUSD) Price Tendency Appears With the Oscillator Indicator
Estimated Reading Time: 2 minutes
Don’t invest unless you’re prepared to lose all the money you invest. This is a high-risk investment and you are unlikely to be protected if something goes wrong. Take 2 minutes to learn more

Free Crypto Signals Channel
ZRXUSD Analysis – ZRXUSD Price Trend Is Stable
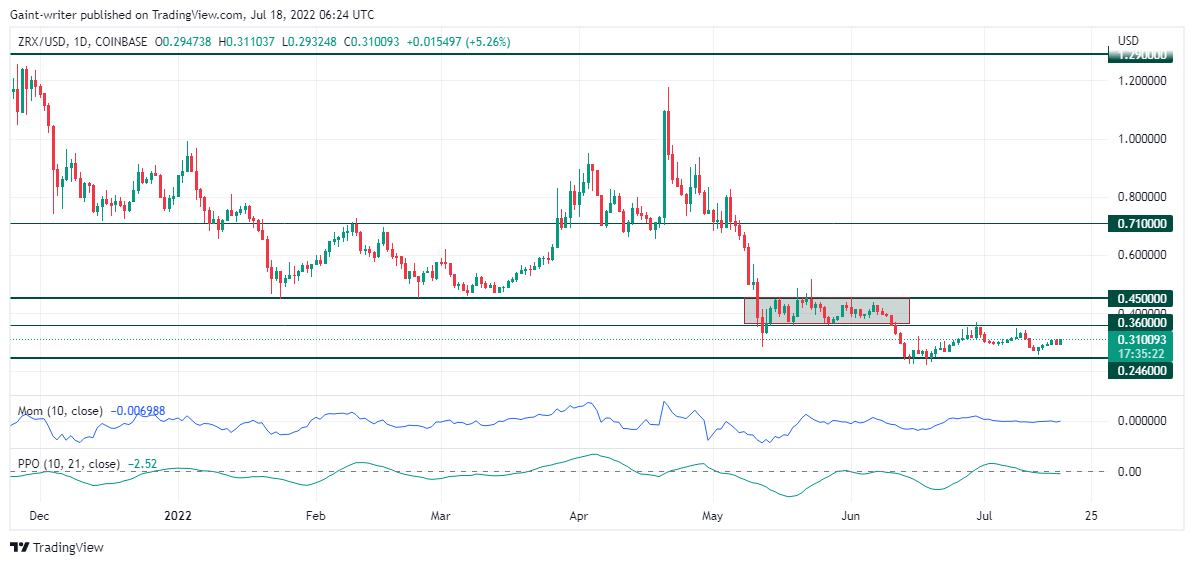
ZRXUSD price tendency appears stable as a result of consolidation across the market. The Price Oscillator indication is slightly close to the 0.00 level, which denotes the middle range of the indicator. This, nonetheless, gives us information about what the ZRXUSD price is currently undergoing. There has been little engagement between the major prospects, including the institutional order flow in price. This has led to a consolidation phase between the crucial levels of $0.3600 and $0.4500.
ZRXUSD Significant Levels
Resistance Levels: $1.2900, $0.7100
Support Levels: $0.4500, $0.36000, $0.24600
ZRXUSD started its momentum drop after the bull’s inability to rush price tendency up to the $1.2900 key level in May 2022. The sellers eventually provoke a dip by filling up the liquidity created by ZRXUSD traders. A big decline which penetrated through the $0.7100 key level took place as the bear market continued to purge due to an increase in bearish strength.
ZRXUSD continued by amassing strength before a more bearish decline by breaking through the $0.36000 key zone down to the $0.24600 significant level. The Price Oscillator Indicator shows the signal unchanged for a while due to the consolidation. The buyers are considering buying up to the $0.36000 key zone as the sideways tendency continues on the daily chart. The momentum indicator is stagnant due to insufficient traders ready to influence prices.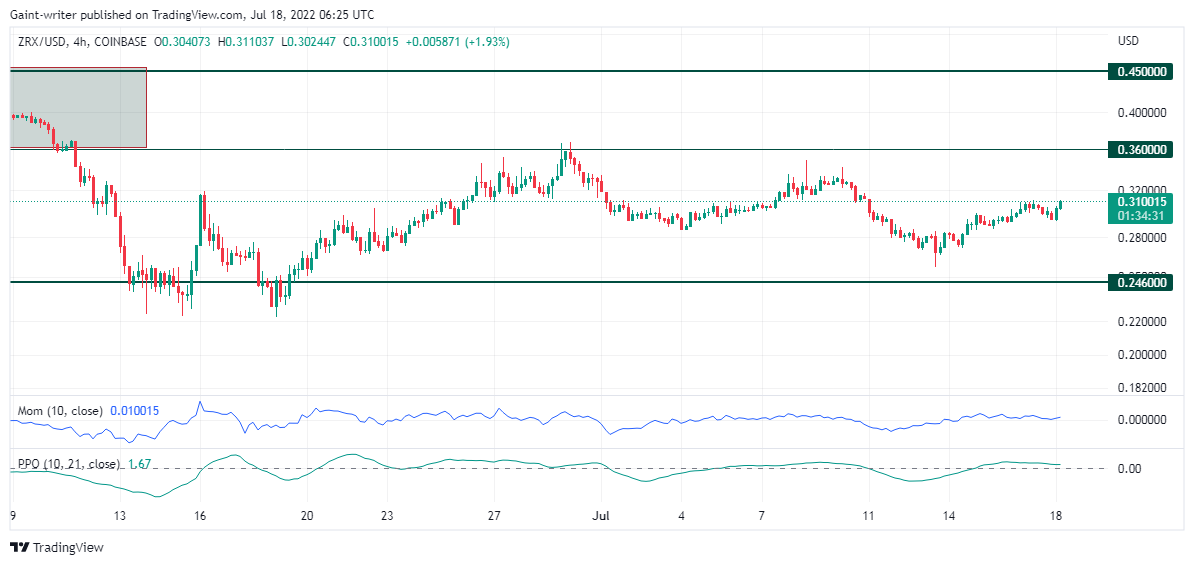
Market Expectations
On the 4-hour chart, the momentum signal is currently located a little to the left of the middle line. As the sideways market continues, the buyers are consolidating their positions in preparation for a possible trade up to the $0.36000 critical zone. Also, the price oscillator shows that buyers are active right now, proving that prices have gone above 0.000 level.
How To Buy Lucky Block
Note: Cryptosignals.org is not a financial advisor. Do your research before investing your funds in any financial asset or presented product or event. We are not responsible for your investing results.