SPONGE/USD ($SPONGE) Advances Toward $0.0001145 Amidst Notable Bullish Momentum
Estimated Reading Time: 3 minutes
Don’t invest unless you’re prepared to lose all the money you invest. This is a high-risk investment and you are unlikely to be protected if something goes wrong. Take 2 minutes to learn more

Current $SPONGE market dynamics have established a confirmed support level at $0.00011, signaling the dominance of bullish sentiment. On November 1st, amid a strong bearish market, bullish traders temporarily converged just below the $0.0001099 price threshold and successfully repelled bearish pressures in this vicinity. It was at this point that the market reversed its course and set its sights on the $0.0001145 price level.
Key Price Levels
- Resistance: $0.000115, $0.000120, and $0.000125.
- Support: $0.000090, $0.000080, and $0.000085.
SPONGE/USD ($SPONGE) Price Analysis: Technical Insights
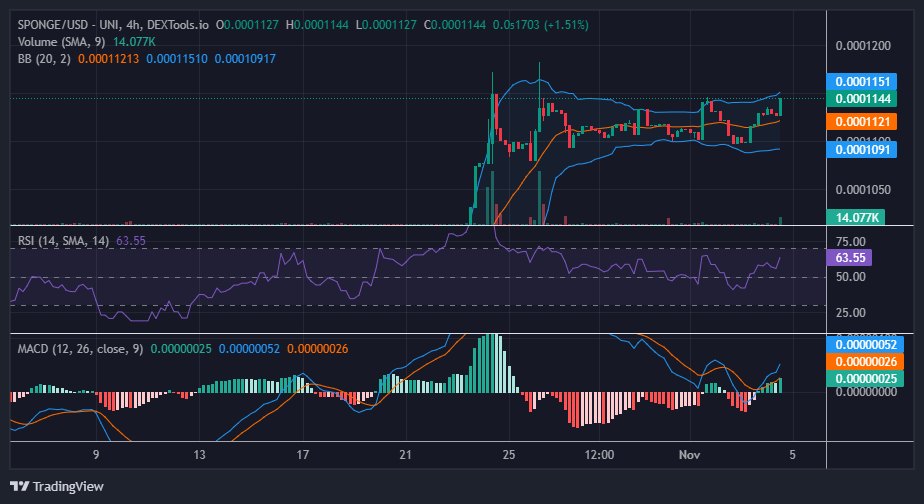
The $SPONGE market has recently established support above the 20-day moving average, influencing the upper bands of the Bollinger Bands indicator. Consequently, the indicator is showing signs of transitioning into an upward trend. If bullish momentum persists, there is potential for the market to approach the $0.00012 price level, as it had previously tested levels in close proximity on October 26. Additionally, the RSI line has exhibited a sharp rise, reaching 63.55, indicating the strength of the prevailing bullish trend.
Short-Term Outlook: 1-Hour Chart
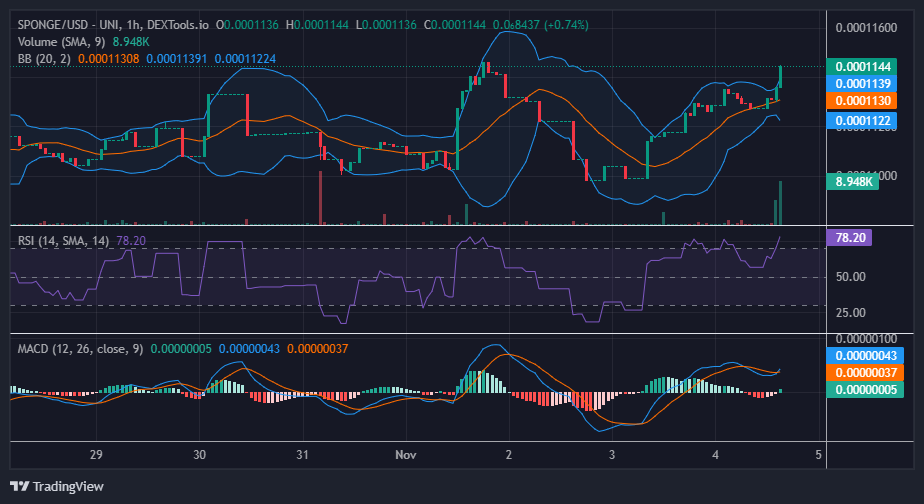
The $SPONGE market initially exhibited a robust upward trend, with limited indications of substantial trading volume during trading sessions. However, more recently, a surge of traders has entered the bullish market, propelling prices toward the targeted $0.0001145 level. The Bollinger Bands indicator experienced a brief convergence before the bullish market advanced to this milestone. This noteworthy price movement was accompanied by substantial histograms, underscoring the strength of the bull market.
The bullish momentum appears robust, raising the possibility of the market surpassing the $0.0001145 price target, given the current strength of the bull market. It’s worth noting that, historically, many traders may have positioned their sell orders around this level.
The distribution of the $SPONGE airdrop is almost here!
🔥 3 Days to Go, #SPONGERS! 🔥
The $SPONGE Airdrop distribution is just around the corner! 🧽💦
Set your reminders for November 7th!#SpongeAirdrop #Crypto #Airdrop pic.twitter.com/ID3odQNVgU
— $SPONGE (@spongeoneth) November 4, 2023
Invest in the hottest and best meme coin. Buy Sponge ($SPONGE) today!