SPONGE/USD ($SPONGE) Bullish Traders Anticipating an Upward Price Breakout
Estimated Reading Time: 2 minutes
Don’t invest unless you’re prepared to lose all the money you invest. This is a high-risk investment and you are unlikely to be protected if something goes wrong. Take 2 minutes to learn more
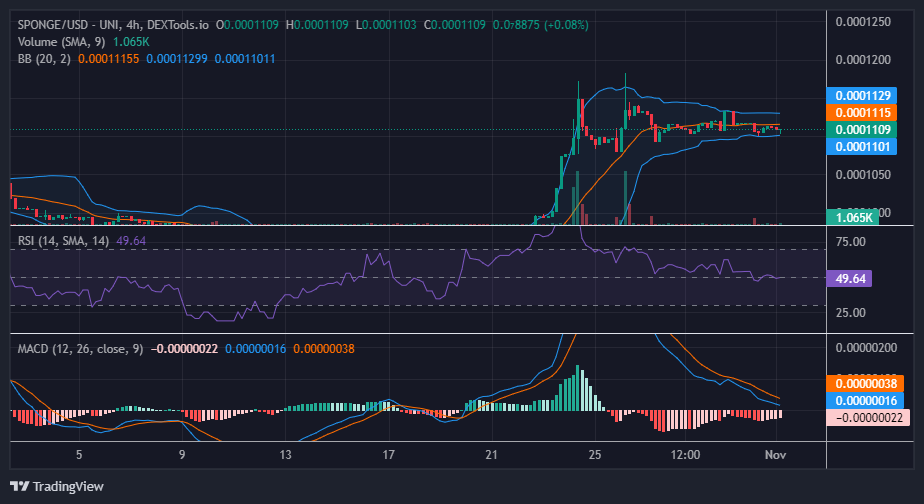
As the SPONGE/USD market remains locked in a price struggle at the $0.00011 threshold, there is a mounting expectation of an upward breakout, potentially extending the prevailing upward trend. The rapid rebound of the market following its interaction with the crucial $0.00011 price level suggests the enduring strength of bullish sentiment in this region. The establishment of this level as a key support point is pivotal for sustaining the upward trajectory of the price.
Key Price Levels
- Resistance: $0.000115, $0.000120, and $0.000125.
- Support: $0.000090, $0.000080, and $0.000085.
Sponge (SPONGE/USD) Price Analysis: Technical Insights
Upon a careful examination of the SPONGE/USD market, as reflected by the Bollinger Bands, it becomes apparent that the market action is currently shaping a symmetrical triangle pattern. This technical pattern suggests an impending breakout, which could manifest either in a bullish or bearish direction. Presently, the market remains firmly ensconced in a state of equilibrium, with heightened volatility.
Notably, the most recent candlestick on the 4-hour chart takes the form of a hammer, signaling a bullish push through the resistance level by the bulls.
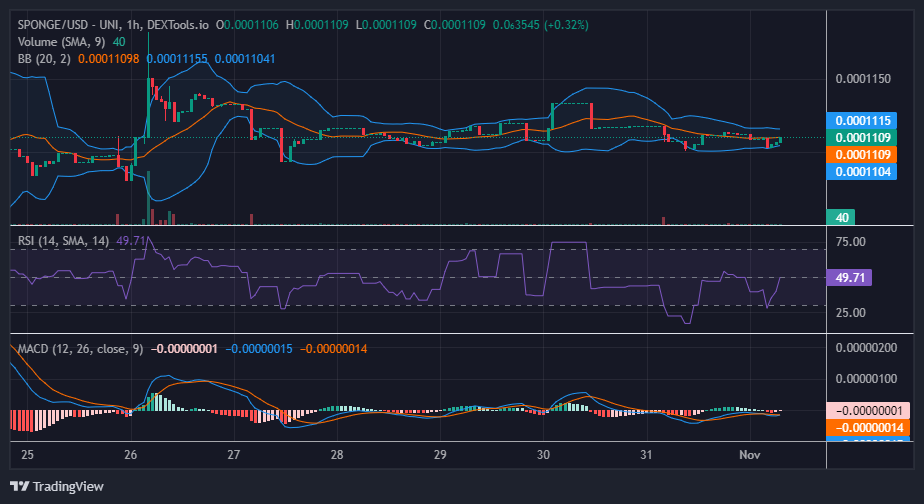
Short-Term Outlook: 1-Hour Chart
While conducting a thorough analysis of the SPONGE/USD market’s 1-hour chart, an intriguing observation comes to light: the Bollinger Bands are currently contracting in response to the market’s horizontal price movement. This constriction pattern is a signal that could potentially herald an imminent price breakout. Traders commonly interpret the convergence of Bollinger Bands within a market exhibiting horizontal price movement as a key indicator of an impending significant price shift or breakout. In this case, we are anticipating the breakout to be in the upside direction.
Buy SPONGE/USD today!
Bring it on 🧽🧽🧽🧽💦💦💦#Crypto #Trading $PEPE $SPONGE pic.twitter.com/xuMd4AhWRO
— $SPONGE (@spongeoneth) November 1, 2023
Invest in the hottest and best meme coin. Buy Sponge ($SPONGE) today!