Decreasing Volatility on Synthetix (SNXUSD) Keeps Bears in Control
Estimated Reading Time: 3 minutes
Don’t invest unless you’re prepared to lose all the money you invest. This is a high-risk investment and you are unlikely to be protected if something goes wrong. Take 2 minutes to learn more
Synthetix Bears Takes Advantage of Decreasing Volatility to Keep the Market in Control
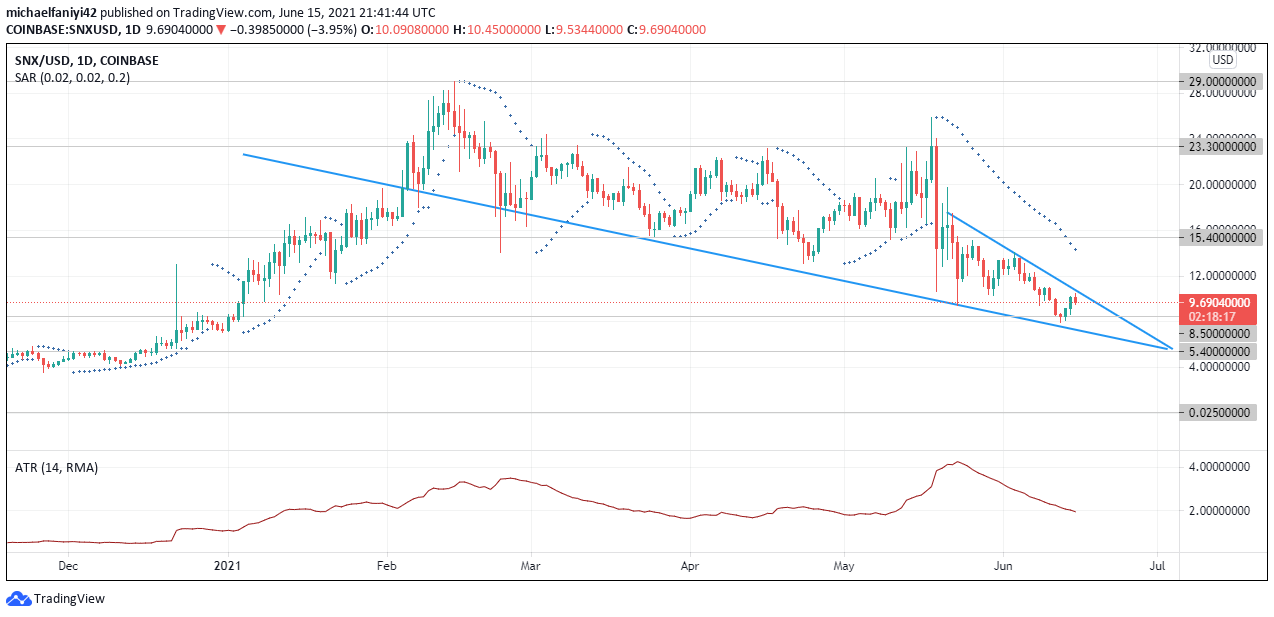
The effect of decreasing volatility on Synthetix is that the bears remain in control. The market had endured a consolidation phase between the 22nd of February 2021 and the 17th of May 2021. This was after a price pump on SNX earlier in the year had taken the market from $8.500 to $29.000 key level. Thereafter, the price fell slightly below the $15.400 support which propelled it back up, but the market found resistance at $23.300. The two zones became the range at which price consolidated. During this consolidation, volatility was generally decreasing.
On the 18th of May 2021, the market pushed out of the range upwards. The bulls summoned much volatility which rose to 3.11 on the ATR (Average True Range) indicator to do this, but the bears quickly overpowered the market. The bears then, with more volatility pulled down the market beyond the $15.400 support. Buyers tried to retaliate but the bearish pressure ensured that Synthetix eventually found a new abode below the $15.400 key level.
Furthermore, the price has still been decreasing. Synthetix has formed a descending triangle to take the price even lower. The ATR indicator also confirms that since SNXUSD fell below the consolidation range, the volatility has been decreasing rapidly. The indicator shows that the volatility has currently fallen to 1.95 on the daily chart.
The Parabolic SAR (Stop and Reverse) shows that the coin isn’t willing to move up anytime soon. The number of dots currently above the candles is the most since the pump in price at the beginning of the year.
Synthetix Major Zones
Resistance Zones: $29.000, $23.300, $15.400
Support Zones: $8.500, $5.400, $0.025

What Does Decreasing Volatility Mean for Synthetix?

The market is seen to be tapering along with the descending triangle on the 4-hour chart. The volatility is currently at its lowest for the past three months at 0.43. The Parabolic SAR has been coordinating the market’s movement along with the descending triangle. A dot is currently seen above the latest 4-hour candle, affirming that the market is decreasing again after bouncing down from the upper border of the descending triangle.
With the bears still in control and low volatility, the market will keep approaching $5.400 support.
Note: Cryptosignal.org is not a financial advisor. Do your research before investing your funds in any financial asset or presented product or event. We are not responsible for your investing results.