Movement (MOVE/USD): Is Bearish Momentum Fading as Technicals Signal a Turnaround?
Estimated Reading Time: 3 minutes
Don’t invest unless you’re prepared to lose all the money you invest. This is a high-risk investment and you are unlikely to be protected if something goes wrong. Take 2 minutes to learn more

The Movement (MOVE/USD) market has experienced a prolonged downtrend following its all-time high near the $1.45 price level, which was reached shortly after the token’s apparent launch in early December 2024. Based on limited market data and the sharp initial price movements, MOVE appears to be a relatively new asset.
Since peaking, the market has consistently printed lower highs, signaling sustained bearish pressure. However, recent price action suggests that the aggressive downward momentum may be losing steam. The deceleration in the decline hints at a potential shift in sentiment, as sellers appear to be losing control.
If this trend continues, MOVE/USD could be approaching a critical juncture where consolidation or even a bullish reversal may begin to take shape.
Movement Market Data
- MOVE/USD Price Now: $0.15
- MOVE/USD Market Cap: $390 million
- MOVE/USD Circulating Supply: 2.6 billion MOVE
- MOVE/USD Total Supply: 10 billion MOVE
- MOVE/USD CoinMarketCap Ranking: #133
Key Levels
- Resistance: $0.50, $0.60, and $0.70
- Support: $0.40, $0.35, and $0.35
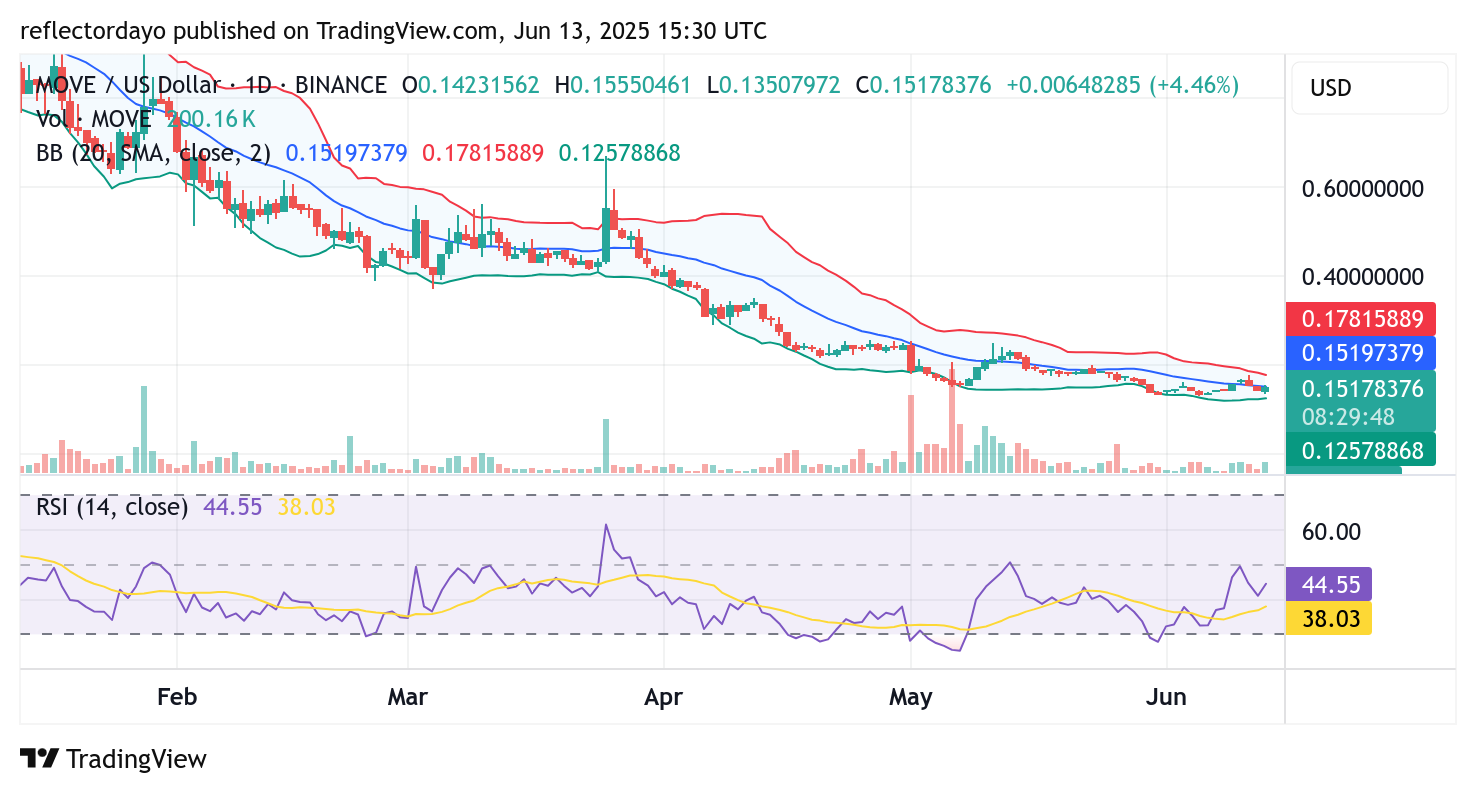
MOVE/USD Technical Outlook: Bullish Momentum Emerges as Market Tests Key Resistance
Following a prolonged bearish trend that began shortly after its launch in late 2024, Movement (MOVE/USD) appears to be entering a new phase. The sharp decline that defined its early trading has gradually lost momentum over the past few months, with the price now stabilizing near the $0.15 level—potentially marking a market bottom.
Currently, MOVE/USD is consolidating within a defined range, suggesting that market participants are awaiting a breakout to determine the next directional move. While the broader trend has been bearish, the intensity of downward pressure is now easing, giving rise to a possible bullish reversal—or at least a temporary pause in the downtrend.
If bulls manage to push the price above nearby resistance, a short-term rebound may follow, signaling the beginning of a shift in market sentiment.
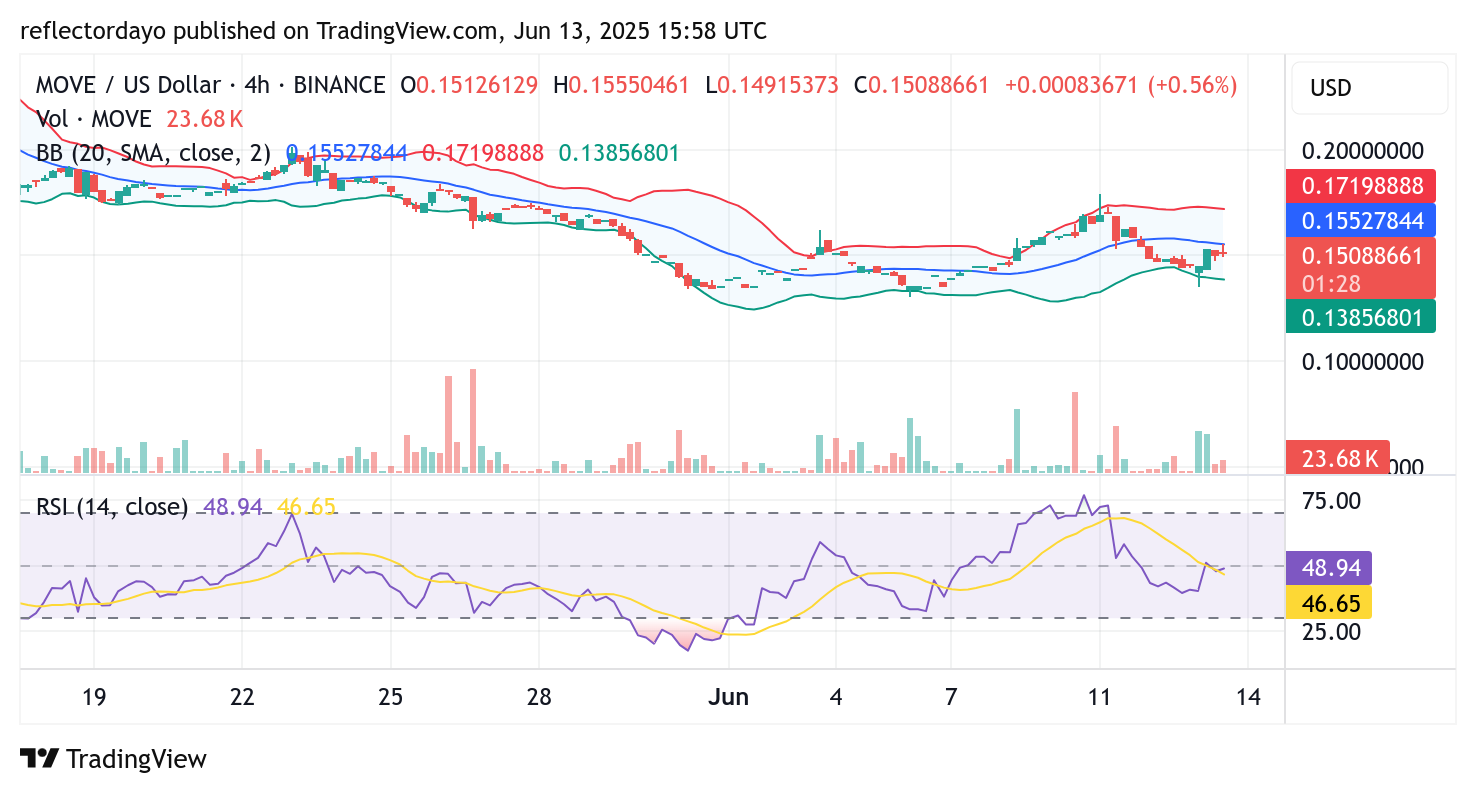
MOVE/USD 4-Hour Chart: Market Stabilizes Around $0.15 as Bullish Effort Strengthens
On the 4-hour timeframe, the $0.15 level has emerged as a key equilibrium zone, with price action oscillating around this threshold. Despite a prior sharp decline, the market is now showing signs of consolidation, indicating that selling pressure may be easing.
Bulls have successfully defended support near $0.13 and are now working to establish firmer control over the $0.15 level, attempting to shift sentiment away from the bearish bias. The current price activity reflects a tug-of-war between buyers and sellers, with no decisive breakout yet.
While the bearish momentum has weakened, overall sentiment remains cautious. A strong move above the $0.15 resistance, backed by significant trading volume, could spark renewed bullish interest. Until then, the outlook remains neutral to slightly bearish as the market continues to consolidate.