Polygon (MATIC/USD) Price Is Reversing, Trying to Regain a Base
Estimated Reading Time: 3 minutes
Don’t invest unless you’re prepared to lose all the money you invest. This is a high-risk investment and you are unlikely to be protected if something goes wrong. Take 2 minutes to learn more
Polygon Price Prediction – February 25
The crypto signal momentum that is featured in the Polygon trade versus the worth of the US Dollar appears to rise back quickly against the resistance spot of $1.10, as the situation has been to be reversing some points that have been obtained close to it from the underneath, trying to grain a base.
As of the time of this analysis, the rate of dropping forces has been gradually acquiring a decrease that is appealing to attaining a shorting entry. In the meantime, most activities relating to the execution of any position orders may be suspended for a while because it seems that they are relatively in recessive motion, causing a kind of indecision.
MATIC/USD Market
Key Levels:
Resistance levels: $0.95, $1.05, $1.15
Support levels: $0.75, $0.70, $0.65
MATIC/USD – Daily Chart
The MATIC/USD daily chart showcases that the crypto-economic market has been reversing points, trying to regain a base.
The process that tends to lead to a development that will lead to the market’s capacity of regaining the base will be when a notable candlestick merges purposely to rise above some of the lengths of the penultimate decreasing candlesticks. As of the time of this technical write-up, the stochastic oscillators have been placed southbound to reach the point of 40.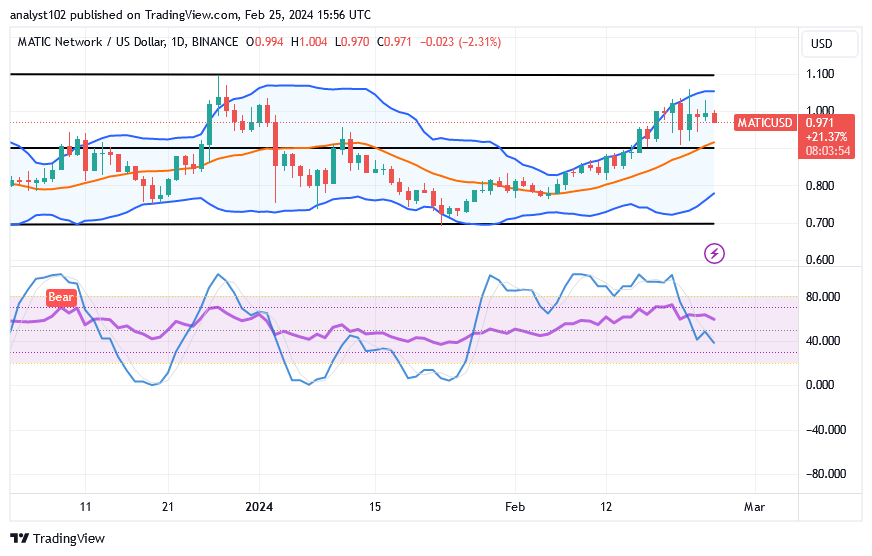
Should investors start to progressively withdraw from the MATIC/USD market given the forecast of the indicators’ conditions?
It might be a good technical trade approach for capitalists to pull out some of their positions in profits before a rebound surfaces, as the MATIC/USD market is reversing, trying to regain a base.
Around $0.90, the middle Bollinger line is observed to be providing support. If there are significant declines ahead, the lower Bollinger Band is about to indicate that a lower point at $0.80 will ultimately be the more difficult support to overcome.
When discussing the southward price movements, it is crucial to take into account the resistance level of $1.05, where the price experienced rejections before gradually turning downward. Having said that, sellers need to be cautious in case the price moves back up if the following active move doesn’t bring it down to a minimum of $0.090 or $0.80.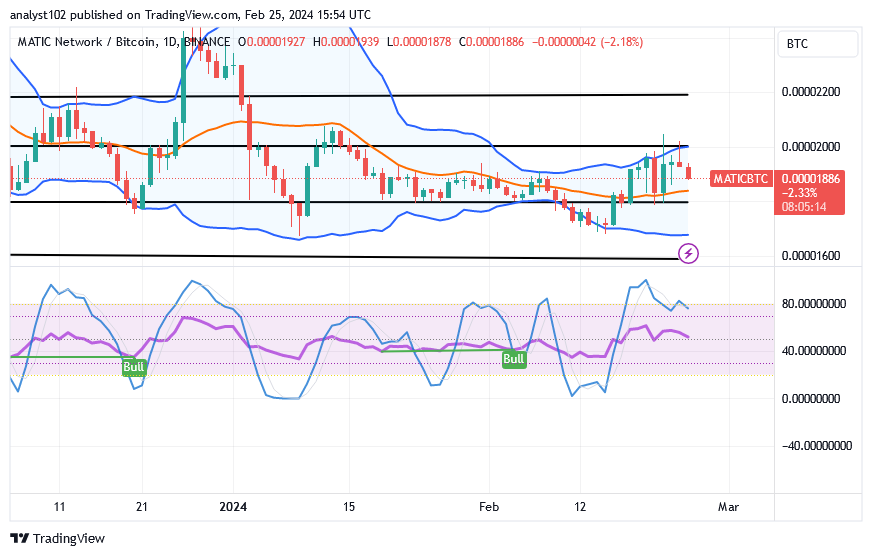
MATIC/BTC Price Analysis
In comparison, the Polygon trade has embarked on a reversing move against Bitcoin, not tending to regain a base in the near future.
The stochastic oscillators’ posture in the overbought area indicates that certain lines will decrease against the core cryptocurrency economy for a time. The Bollinger Band indicators are placed tentatively to maintain the wide range-bound spots that the pairing crypto market has been pushing over a couple of times. That demonstrates that a series of delays have occurred, allowing the price to retake lower zone positions.
Note: Cryptosignals.org is not a financial advisor. Do your research before investing your funds in any financial asset or presented product or event. We are not responsible for your investing results.
You can purchase Lucky Block here. Buy LBLOCK