Arbitrum Price Prediction: ARB/USD Moves in the Same Direction as the Price Ready for the North
Estimated Reading Time: 3 minutes
Don’t invest unless you’re prepared to lose all the money you invest. This is a high-risk investment and you are unlikely to be protected if something goes wrong. Take 2 minutes to learn more
Arbitrum Price Prediction – June 3
The Arbitrum price prediction reveals that if bulls begin to increase their momentum, the price will cross above the moving averages.
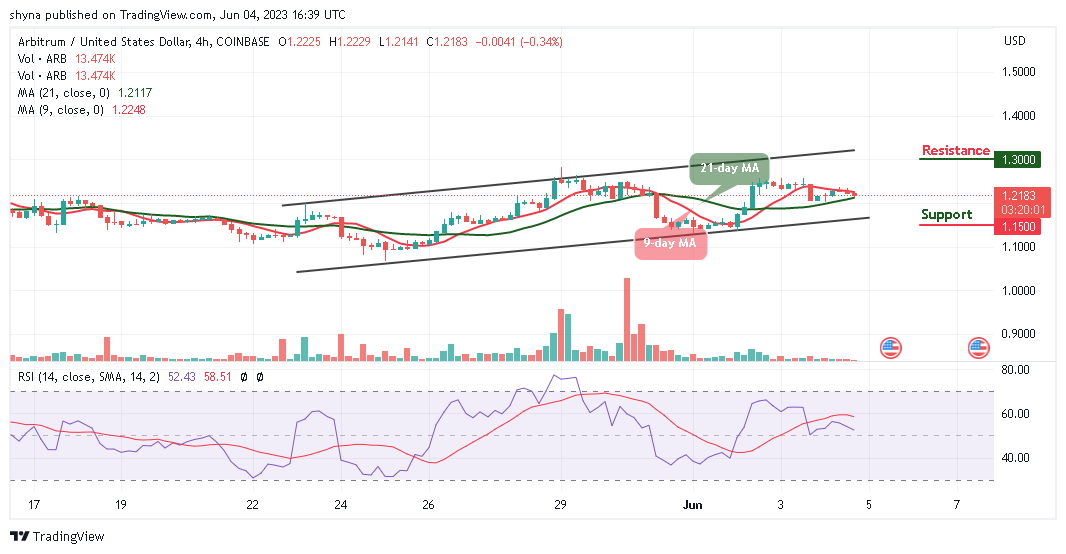
ARB/USD Medium-term Trend: Ranging (4H Chart)
Key Levels:
Resistance levels: $1.30, $1.35, $1.40
Support levels: $1.15, $1.10, $1.05
ARB/USD is moving sideways within the 9-day and 21-day moving averages at the time of writing, the bullish momentum will make the coin move toward the $1.25 resistance level. Meanwhile, if the bulls fail to drive the price to the upside, the Arbitrum price could retreat before heading to the upside.
Arbitrum Price Prediction: ARB/USD Keeps Preparing for the Upside
According to the daily chart, the Arbitrum price is hovering at $1.21 where it could spike to the north. The Arbitrum price will begin to move within the 9-day and 21-day moving averages, crossing above this barrier will locate the potential resistance levels at $1.30, $1.35, and $1.40 toward the upper boundary of the channel. Nevertheless, crossing below the lower boundary of the channel can hit the support levels at $1.15, $1.10, and $1.05 for more buyers to come into the market while the technical indicator Relative Strength Index (14) moves above the 50-level.
ARB/USD Medium-term Trend: Ranging (2H Chart)
The Arbitrum price is likely to slide below the 9-day and 21-day moving averages as the technical indicator Relative Strength Index (14) moves below the 50-level. This is for the buyers to prepare for the upward movement, and this could be the best time for more buyers to buy the dip. Meanwhile, any bullish movement above the moving averages can push the coin toward the upper boundary of the channel to hit the resistance level at $1.34 and above.
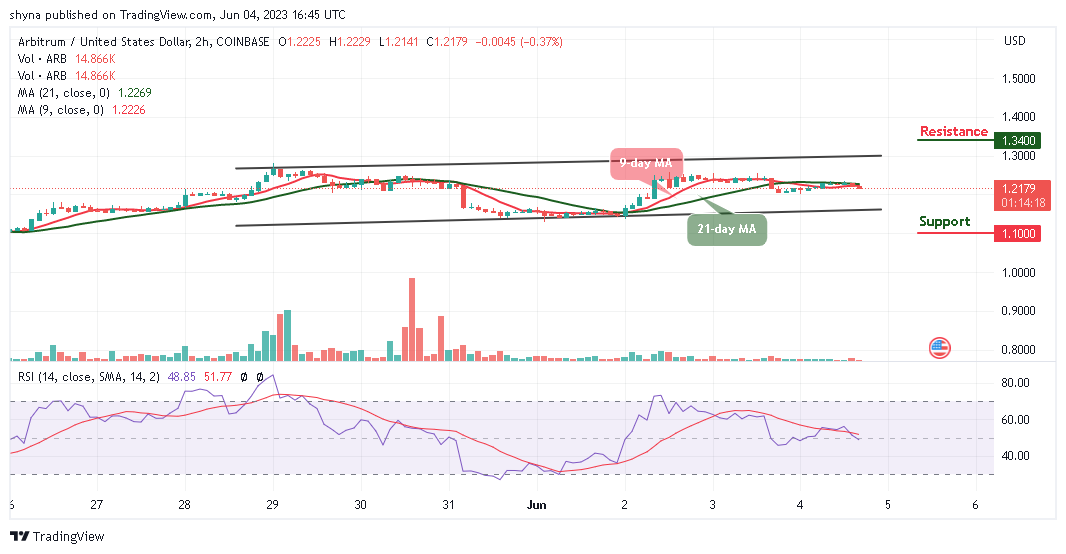
Moreover, the Arbitrum (ARB) can display a few bearish signals and the market price is likely to cross below the lower boundary of the channel where it can hit critical support at $1.10 and below. Notwithstanding the movement of the coin, the best time to buy it is now as the bulls will begin to push the coin to the upside.
Place winning Arbitrum trades with us. Get ARB here