Arbitrum Price Prediction: ARB/USD Trades Around $1.150; Good Time to Buy
Estimated Reading Time: 3 minutes
Don’t invest unless you’re prepared to lose all the money you invest. This is a high-risk investment and you are unlikely to be protected if something goes wrong. Take 2 minutes to learn more
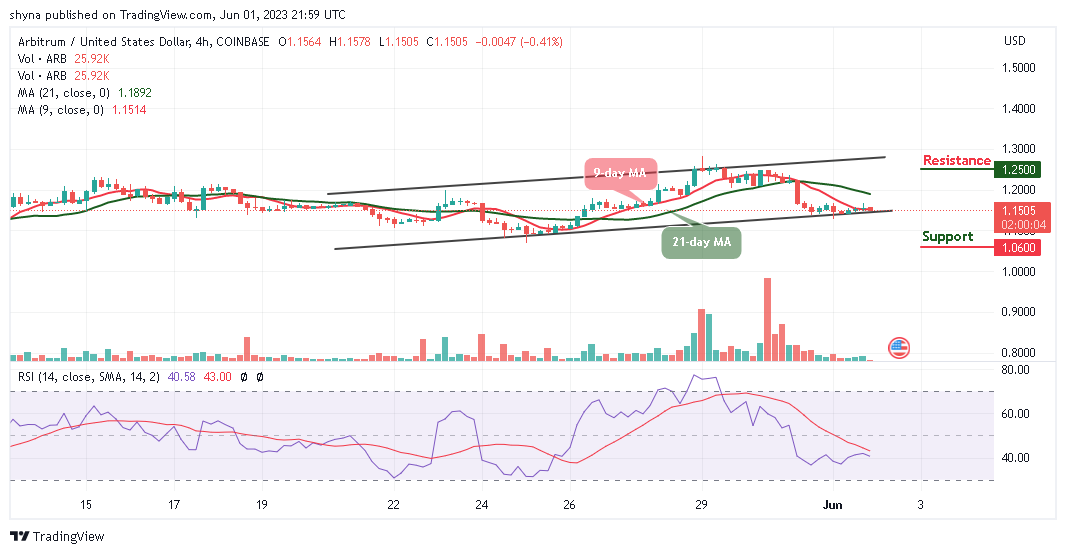
Arbitrum Price Prediction – June 1
The Arbitrum price prediction reveals that ARB drops to touch the daily low of $1.150 as the price dips for new buyers to surface.
ARB/USD Medium-term Trend: Ranging (4H Chart)
Key Levels:
Resistance levels: $1.250, $1.270, $1.290
Support levels: $1.060, $1.040, $1.020
ARB/USD is at the time of writing trading at $1.150 around the 9-day moving average. According to the chart, sellers are pushing the coin toward the south and this could allow the new buyers to step into the market while the existing buyers are expected to buy the dips.
Arbitrum Price Prediction: ARB Price Could Retreat to Move Higher
The Arbitrum price at the time of writing becomes cheap for more buyers to come into the market. However, the coin can drop more as the technical indicator Relative Strength Index (14) reveals, but the market will expect move investors to come into the market, any further supports could be located at $1.060, $1.040, and $1.020.
Moreover, should the buyers hold the current support of $1.150 and push the coin higher; the bulls can expect immediate resistance to be located at $1.200. Any further bullish movement above the 21-day moving average will hit the resistance level of $1.250, $1.270, and $1.290 respectively.
ARB/USD Medium-term Trend: Bearish (2H Chart)
On the 2-hour chart, the Arbitrum price remains within the 9-day and 21-day moving averages; this is the best opportunity for new buyers to enter the market. Similarly, the existing buyers are expected to invest in this coin as the market gathers momentum to begin another bullish movement.
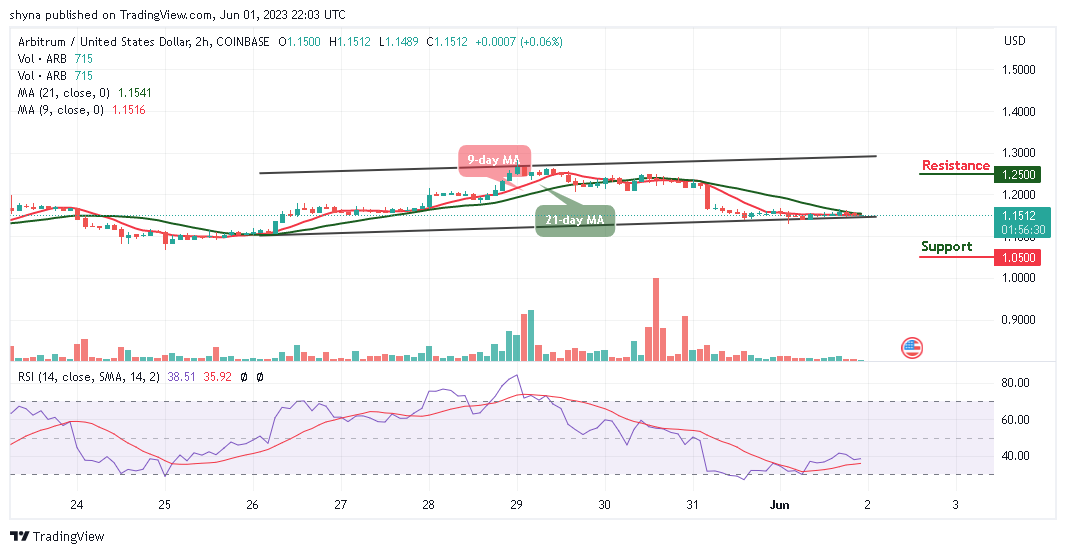
From above, if the buyers push the price toward the upper boundary of the channel; higher resistance could be found at $1.250 and above. Moreover, should the coin retreat and slide below the lower boundary of the channel, support may come at $1.050 and below, while the Relative Strength Index (14) moves to cross above the 40-level.
Place winning Arbitrum trades with us. Get ARB here