Wall Street Memes (WSM) Price Bounces, Shaping Hiking Moves
Estimated Reading Time: 3 minutes
Don’t invest unless you’re prepared to lose all the money you invest. This is a high-risk investment and you are unlikely to be protected if something goes wrong. Take 2 minutes to learn more
Wall Street Memes Price Prediction – April 17
Price movements associated with the business operations of the Wall Street Memes coin, when evaluated against the US dollar, indicate a period of stabilization and potential structural consolidation within the crypto market at relatively subdued valuation levels, given that the price bounces are reshaping hiking moves.
Price action frequently tests the lower Bollinger Band, signaling potential accumulation zones, while subsequent contractions in Bollinger Band width suggest a buildup of latent volatility. These phases of consolidation and measured retracements offer strategic entry points near key support levels, positioning buyers advantageously ahead of probable volatility breakouts and directional price surges within the broader trading cycle.
WSM/USD Market
Key Levels
Resistance levels: $0.0015, $0.002, $0.0025
Support levels: $0.0008, $0.0006, $0.0004
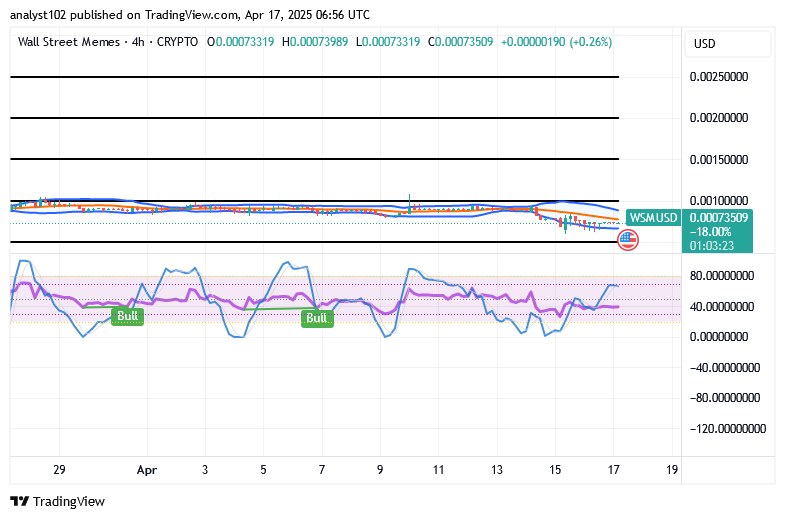
WSM/USD – 4-hour Chart
The WSM/USD medium-term chart setting showcases that the crypto-economic price bounces, reshaping hiking moves.
Variant lower candlesticks, primarily characterized by bullish reversal patterns, are now forming along the extended zones of both the middle and lower Bollinger Bands. This suggests potential price support and emerging buyer interest at these levels. Concurrently, the stochastic oscillator maintains a consistent northbound trajectory, hovering near the oversold threshold, further reinforcing the likelihood of an impending bullish crossover and upward momentum shift.
Will the WSM/USD pair continue consolidating near the Bollinger Bands, maintaining $0.001 as a key resistance zone?
It is likely to still witness different styles in sideways trading that the WSM/USD market will put up with in the following sessions once the level of momentum being garnered by bulls is yet to outweigh the depressing velocity, given that crypto-economic price bounces are reshaping hiking moves at lower spots.
In anticipation of a sustained bullish reversal in the given trading pair, technical indicators now reveal that momentum oscillations, liquidity inflows, and volatility expansions are being tactically engineered on a daily timeframe.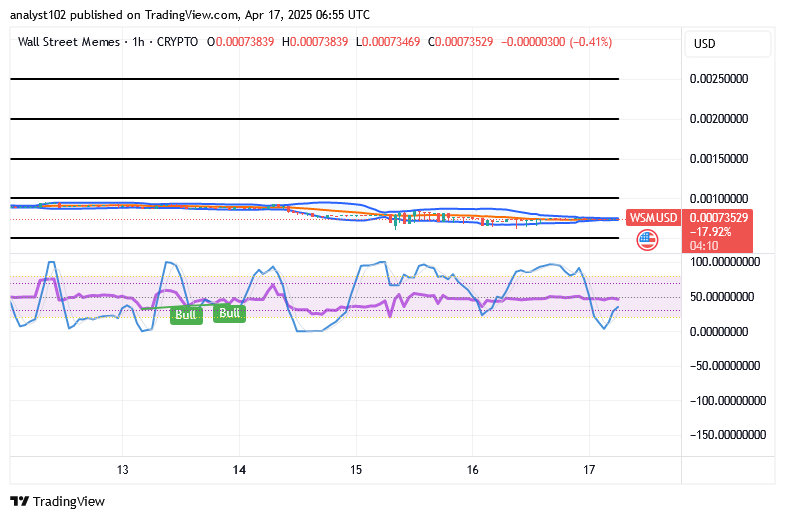
WSM/USD 1-hour chart
The hourly compositions of the WSM/USD market signify that the crypto-economic market bounces are reshaping hiking moves at a decreased spot.
The Bollinger Bands have converged into a narrow, eastward-aligned channel, indicating a phase of market compression and reduced volatility within the trading pair. Simultaneously, the stochastic oscillator remains positioned in the oversold zone, suggesting a heightened probability of an imminent bullish reversal.
$WSM community, we saw your Tweets!
Your sentiment and momentum indicators didn’t go unnoticed!
$WSM / $USDT is now tradeable on #Bybit Perpetuals — complete with leveraged exposure and real-time liquidity tracking.
$WSM community, we saw your Tweets! 👏$WSM / $USDT is now tradeable on #Bybit Perpetuals.
— Bybit (@Bybit_Official) October 13, 2023
Trade here: https://t.co/le4XyVyXaZ
Also want your project listed? Share your suggestions here:https://t.co/W7EWJVVNV5 https://t.co/XgXoL7g0rF