Wall Street Memes (WSM) Trade Is Steady, Fostering Muscles
Estimated Reading Time: 3 minutes
Don’t invest unless you’re prepared to lose all the money you invest. This is a high-risk investment and you are unlikely to be protected if something goes wrong. Take 2 minutes to learn more

Wall Street Memes Price Prediction – April 16
In light of allowing WSM/USD market dynamics greater flexibility to explore broader valuation territories, particularly toward potential all-time lows, the evolving crypto-economic landscape continues to be strategically steadily positioned, fostering muscles.
The WSM/USD markets are currently engaging in measured, strategic price adjustments, gradually shaping more attractive zones for long-position entries. This phase presents renewed opportunities, reinforcing confidence in the strength and resilience of sustained long-holding strategies.
WSM/USD Market
Key Levels
Resistance levels: $0.0015, $0.002, $0.0025
Support levels: $0.0008, $0.0006, $0.0004
WSM/USD – 4-hour Chart
The WSM/USD medium-term chart setting shows that the crypto-economic price is steady, fostering muscles.
The stochastic oscillators are showing a modest upward inclination, gradually moving toward the 40 level after emerging from the oversold region. Simultaneously, the lower Bollinger Band is displaying early signs of expansion, indicating a buildup of momentum that could support the formation of well-positioned long entries at relatively discounted price levels.
The WSM/USD market is tapping the lower Bollinger Band—could this hint at a strong bounce ahead instead of a long drop?
As the WSM/USD trades are tapping the lower part of the Bollinger Bands indicators presently, a firm spike seems to be imminent, given that the crypto’s price is steady, fostering muscles.
Sustained capital inflows into the pairing instruments appear increasingly warranted, even amidst transient downward price action. This structurally supportive and volume-responsive configuration reflects the hallmarks of an emerging accumulation phase—characterized by aligning liquidity dynamics, strengthening momentum, and compressing volatility. As such, market participants may find strategic merit in gradually scaling into positions with calibrated conviction, anticipating favorable directional shifts.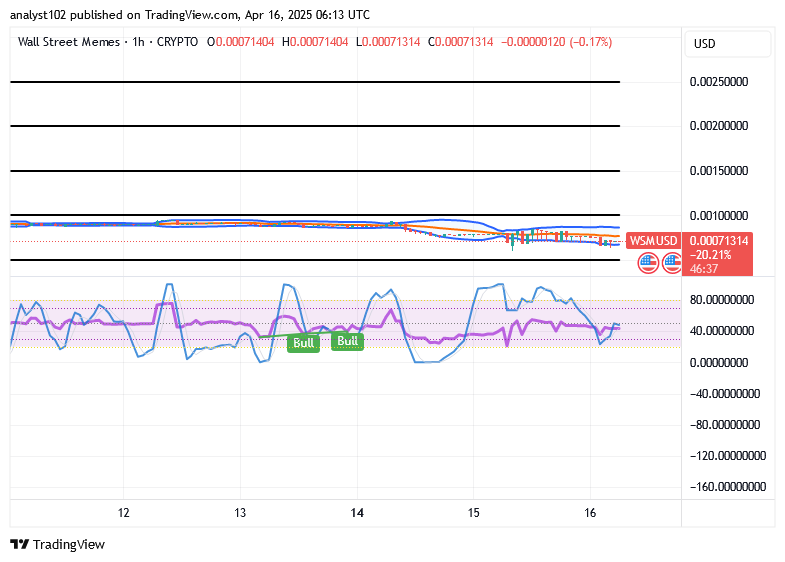
WSM/USD 1-hour chart
The hourly compositions of the WSM/USD market signify that the crypto-economic market is steady on a base, fostering muscles in its inputs.
The stochastic oscillators have exhibited a mild retracement within the 40–20 range, signaling early-stage bullish divergence as momentum consolidates. Concurrently, the Bollinger Bands have widened appreciably, offering a conducive framework for identifying favorable long entry zones at lower price levels—positioning the market for a prospective upside reversal.
$WSM / $USDT is officially live for perpetual contract trading on #Bybit, offering enhanced access, flexibility, and exposure.
$WSM community, we saw your Tweets! 👏$WSM / $USDT is now tradeable on #Bybit Perpetuals.
— Bybit (@Bybit_Official) October 13, 2023
Trade here: https://t.co/le4XyVyXaZ
Also want your project listed? Share your suggestions here:https://t.co/W7EWJVVNV5 https://t.co/XgXoL7g0rF