Bitcoin (BTC) Price Prediction: BTC/USDT Volatility Tightens
Estimated Reading Time: 2 minutes
Don’t invest unless you’re prepared to lose all the money you invest. This is a high-risk investment and you are unlikely to be protected if something goes wrong. Take 2 minutes to learn more

Date: June 4, 2025
Price activity has assumed a less volatile stance. Meanwhile, price action in the Bitcoin market recently rose past the $105,000 level but lacks significant momentum from market participants. Let’s determine where the market may head in the short term.
BTC/USDT Long-Term Trend: Bearish (Daily Chart)
Key Price Levels:
Resistance: $108,000, $110,000, $115,000
Support: $100,000, $90,000, $80,000
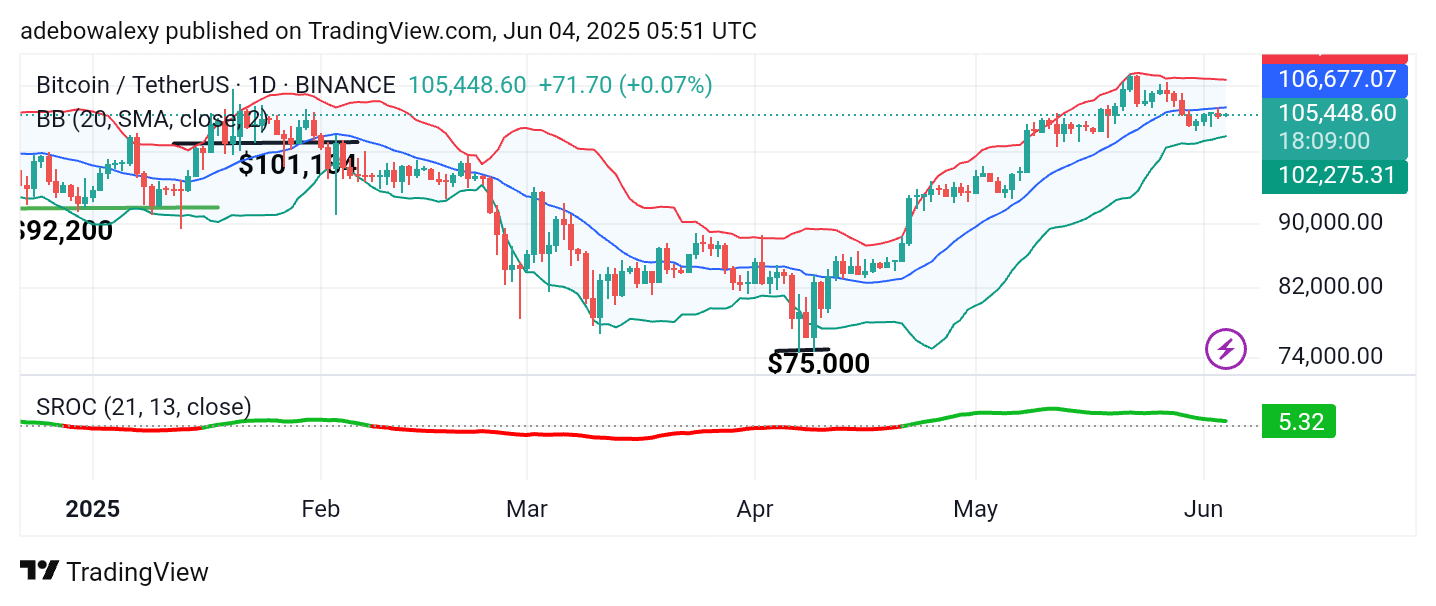
The most recent price candle on the 4-hour chart shows that Bitcoin has moved back above the $105,000 level. As a result, trading activity is occurring just above the middle Bollinger Band. The Bollinger Bands indicator appears slightly narrowed due to reduced price volatility. Meanwhile, the Smoothed Rate of Change (SROC) indicator remains above the equilibrium level but is trending sideways.
Bitcoin (BTC) Price Prediction: BTC/USDT Assumes a Calm Stance
As Bitcoin’s price remains above the $105,000 threshold, it can be observed that the market is moving sideways. The last two price candles on the chart are green but show very little momentum.
Nonetheless, these candles remain just above the middle limit of the Bollinger Bands, mirroring the current path of the bands themselves. Furthermore, the trajectory of the SROC indicator aligns with the ongoing sideways price movement and, as such, suggests no imminent breakout.
Bitcoin (BTC) Price Prediction: BTC/USDT Market Stays Cautious
Even on the 4-hour chart, Bitcoin shows minimal price movement. Similar to the daily chart, recent price candles are positioned above the middle Bollinger Band. However, the most recent candle is red, indicating a slight decline.
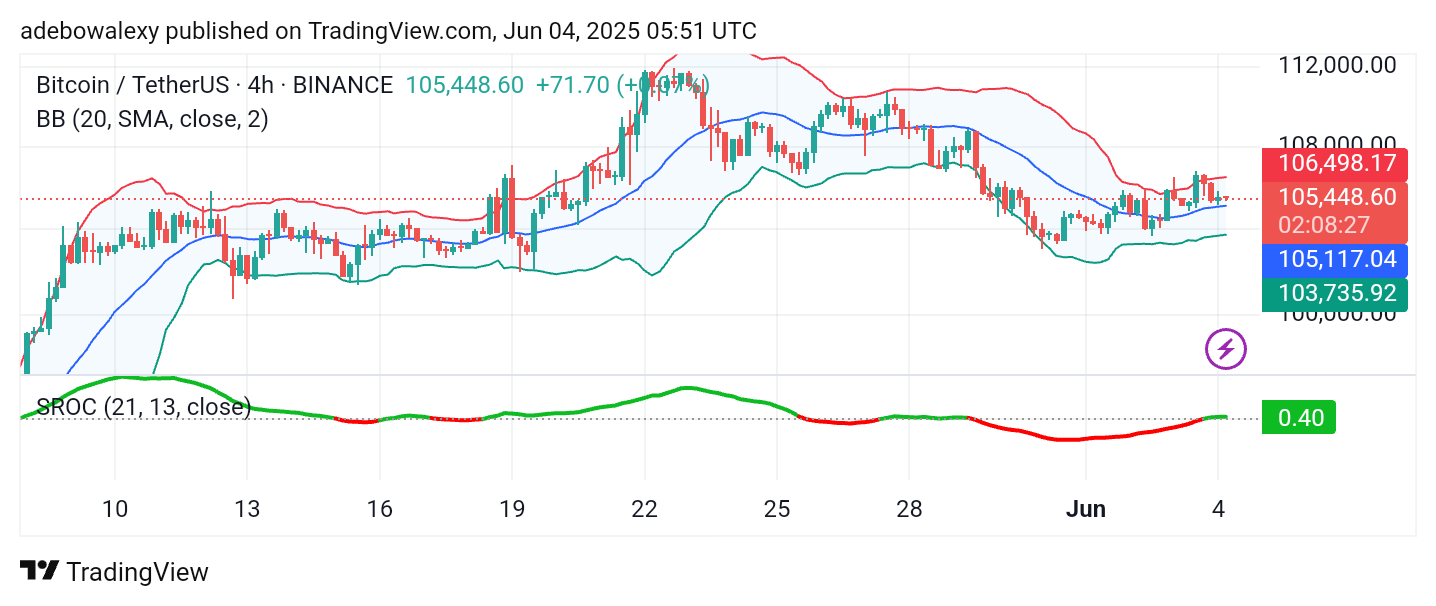
Despite this, price action still holds above the middle band. Meanwhile, the SROC indicator shows a general upward trajectory, with its latest section remaining above the equilibrium level but also trending sideways. Consequently, traders can hope for a potential rebound from the middle Bollinger Band, possibly pushing prices toward the $108,000 level and perhaps to $110,000.