Litecoin (LTC) Price Prediction: LTC/USDT Sees a Rebound
Estimated Reading Time: 3 minutes
Don’t invest unless you’re prepared to lose all the money you invest. This is a high-risk investment and you are unlikely to be protected if something goes wrong. Take 2 minutes to learn more
Date: June 3, 2025
While the Litecoin market remains correlated with the Bitcoin market, the token has experienced an upward rebound. This trend has continued so far, but momentum appears to wane. Let’s analyze how the market may proceed from here.
LTC/USDT Long-Term Trend: Bearish (Daily Chart)
Key Price Levels:
Resistance: $90.00, $100.00, $110.00
Support: $80.00, $70.00, $60.00
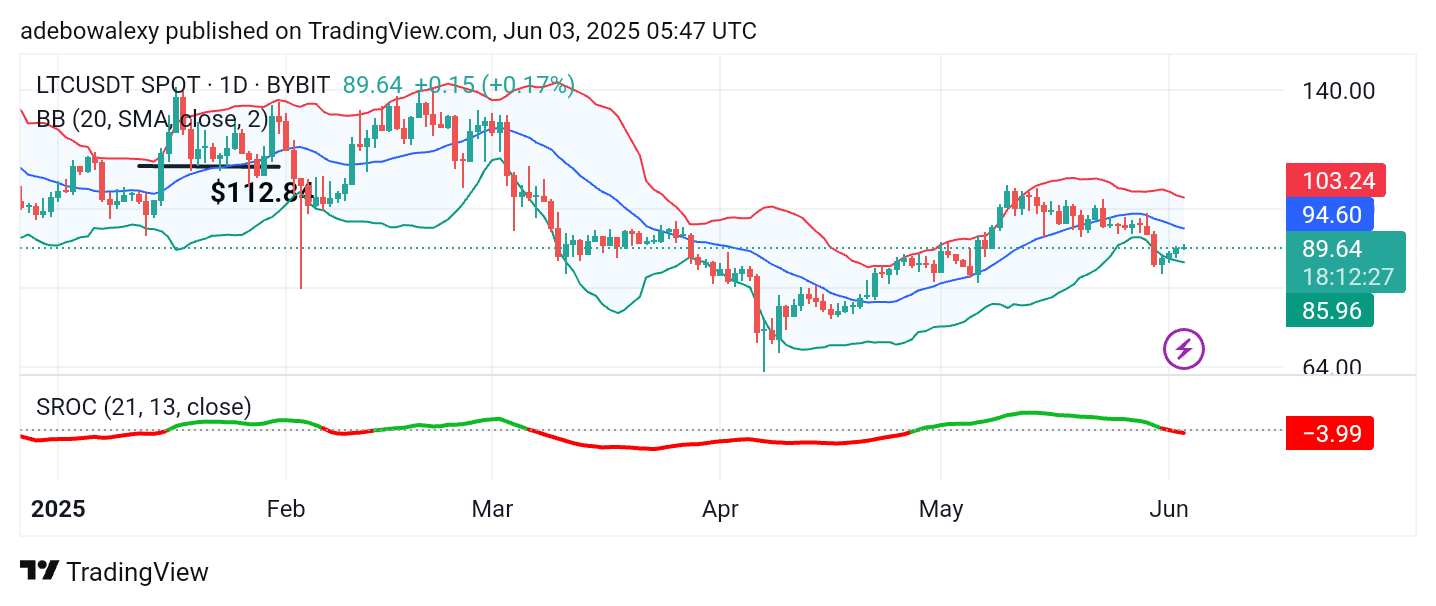
The ongoing trading session in the Litecoin market remains in the green, as seen in the latest price candle on the chart. Nevertheless, the recently appearing price candles are still positioned below the middle Bollinger Band. Meanwhile, the Smoothed Rate of Change (SROC) indicator line has just fallen below the equilibrium level. The terminal part of the indicator appears to be beginning a sideways movement but remains red while it stays below the equilibrium level.
Litecoin (LTC) Price Prediction: LTC/USDT Upward Retracement May Get Subdued
Price action in the Litecoin daily chart has shown a slight upward retracement spanning three consecutive sessions. However, the price remains below the equilibrium level.
A closer look at the last three price candles on the daily chart indicates that this upward retracement is progressively losing momentum. The movement of the SROC indicator also supports this view, as it shows the line remaining below the equilibrium level. Therefore, traders should exercise caution at this time, as upward movement appears to be under significant threat.
Litecoin (LTC) Price Prediction: LTC/USDT Bulls Look Strained
On the 4-hour price chart, it is evident that the bullish momentum is gradually decreasing. The last two price candles appear very small, suggesting market strain and the potential for a downward retracement.
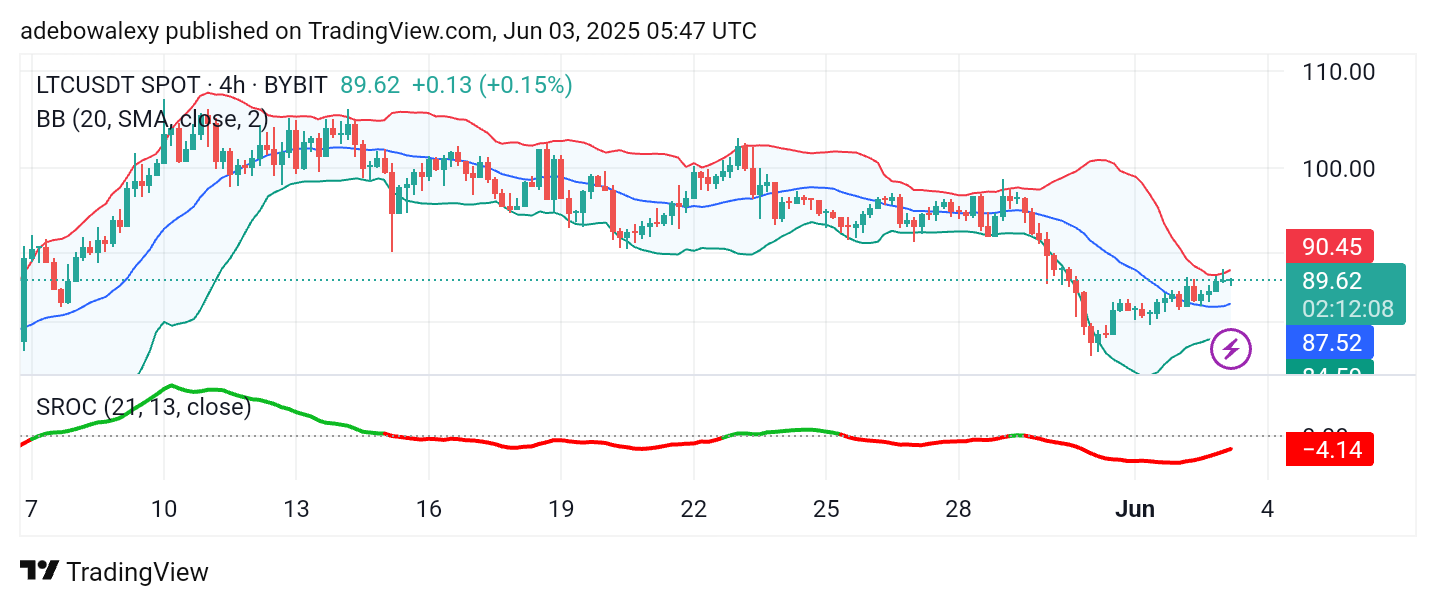
Furthermore, price action tests the upper limit of the Bollinger Bands indicator, which may indicate a possible reversal. However, the small size of the recent price candles suggests that the market is moving cautiously and may not immediately trigger a reversal. The movement of the SROC indicator, however, suggests that bullish forces are still in the lead and may support a slight further price increase—potentially toward the $95.00 level.