Dogecoin (DOGE) Price Prediction: DOGE/USDT Continues to Fall
Estimated Reading Time: 2 minutes
Don’t invest unless you’re prepared to lose all the money you invest. This is a high-risk investment and you are unlikely to be protected if something goes wrong. Take 2 minutes to learn more
Date: June 2, 2025
Since the Bitcoin market pulled back from its new all-time high, the Dogecoin market has also come under strong bearish pressure. As of the time of writing, the market has broken through the support at the $0.2000 price level.
DOGE/USDT Long-Term Trend: Bearish (Daily Chart)
Key Price Levels:
Resistance: $0.2000, $0.2500, $0.3000
Support: $0.1900, $0.1500, $0.1000
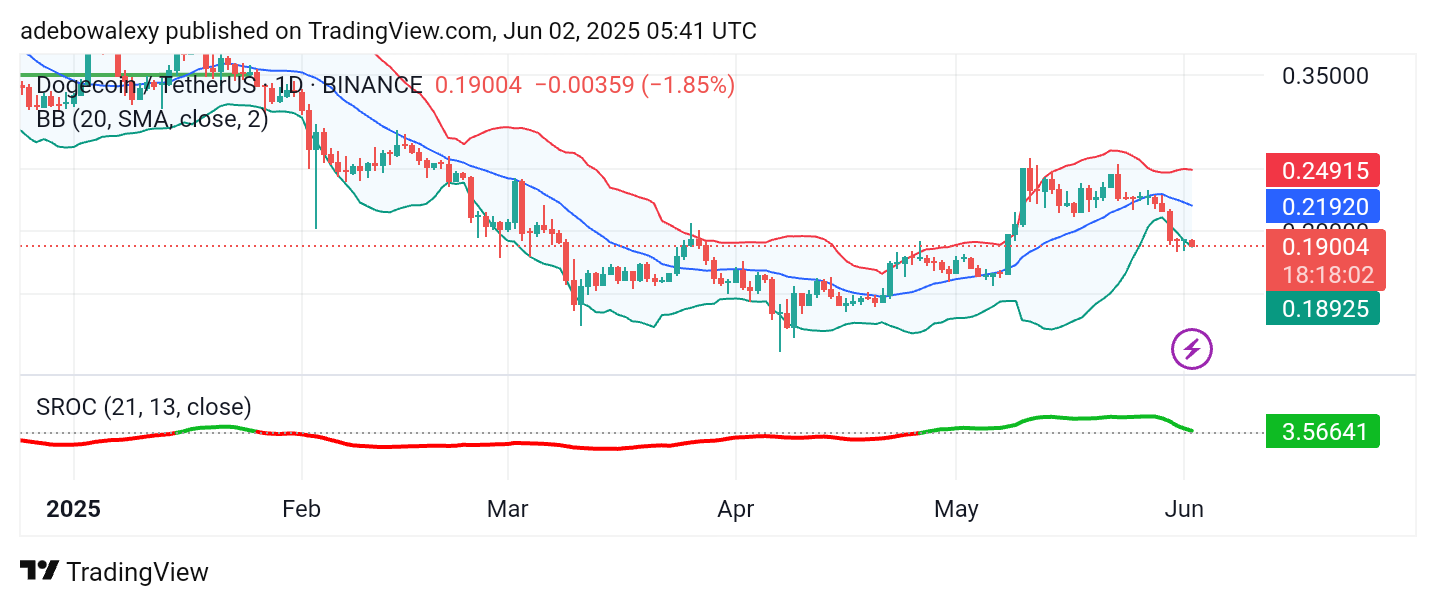
Price activity in the Dogecoin market has experienced a significant pullback in recent times. The latest price candle on the chart is positioned below the psychological support level at $0.2000. This red candle continues to press against the lower limit of the Bollinger Bands. Similarly, the Smoothed Rate of Change (SROC) indicator line is now just above the equilibrium level.
Dogecoin (DOGE) Price Prediction: DOGE/USDT Market May See More Price Declines
Activity on the Dogecoin daily chart points to a strengthening bearish sentiment. Price action has fallen below key technical levels and continues to move lower. The latest price candle on this token’s daily chart is red, suggesting that downward pressure is increasing compared to the previous session.
Additionally, the SROC indicator line is now touching the equilibrium level from above. Should bearish sentiment intensify, the SROC line may descend below the equilibrium level, indicating further price declines.
Dogecoin (DOGE) Price Prediction: DOGE/USDT Continues on a Bearish Path
The Dogecoin market remains on a bearish trajectory even on the 4-hour chart. Price activity continues to hold below the midline of the Bollinger Bands. The latest price candle is red and has pushed the market further down toward the $0.1900 price level.
Meanwhile, the Bollinger Bands indicator continues to contract, which often signals a buildup toward further price declines. The SROC line is also below the equilibrium level. These indications suggest that the market may experience additional downward movement toward the $0.1800 price level.