Polygon (ex-MATIC) Price Prediction: POL/USDT Heads South
Estimated Reading Time: 2 minutes
Don’t invest unless you’re prepared to lose all the money you invest. This is a high-risk investment and you are unlikely to be protected if something goes wrong. Take 2 minutes to learn more

Date: May 31, 2025
Over the past few months, there have been some new developments concerning the Polygon (ex-MATIC) token. Although there was some upside correction, the bullish momentum wasn’t particularly strong. Price action in this market seems poised to breach a medium-term support level at $0.2000.
POL/USDT Long-Term Trend: Bearish (Daily Chart)
Key Price Levels:
Resistance: $0.2250, $0.2500, $0.2750
Support: $0.2000, $0.1750, $0.1500
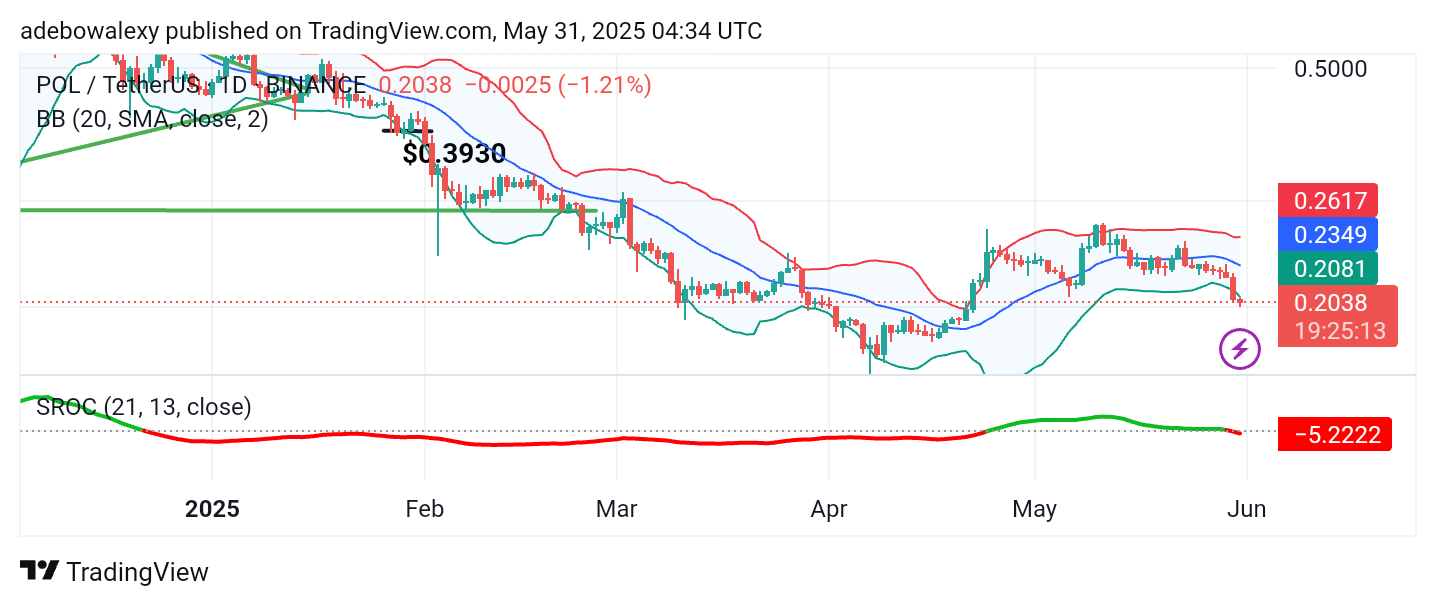
Price action on the Polygon (ex-MATIC) daily chart has been pressing against the lower boundary of the Bollinger Bands. The most recent price candle is red, indicating further downward retracement. Moreover, it has appeared below the lower band of the Bollinger Bands indicator. Additionally, the Smoothed Rate of Change (SROC) indicator lines can be seen plunging below the equilibrium level.
Polygon (ex-MATIC) Price Prediction: Headwinds in POL/USDT Market Are Dominant
The Polygon (ex-MATIC) market has remained generally bearish since the failed attempt to breach the $0.2800 price level. However, the red price candle for the ongoing session appears relatively small and has formed below the lower boundary of the Bollinger Bands.
Similarly, the SROC indicator line has dropped below the critical equilibrium level. Furthermore, the indicator line has turned red at the terminal point and is trending downward. Consequently, the signals from this market remain strongly bearish, suggesting that price activity may decline further.
Polygon (ex-MATIC) Price Prediction: POL/USDT Lies Under Headwinds
Even on the 4-hour chart, it is evident that price action remains bearish. The most recent price candle is red, reinforcing the notion that the market is susceptible to further declines.
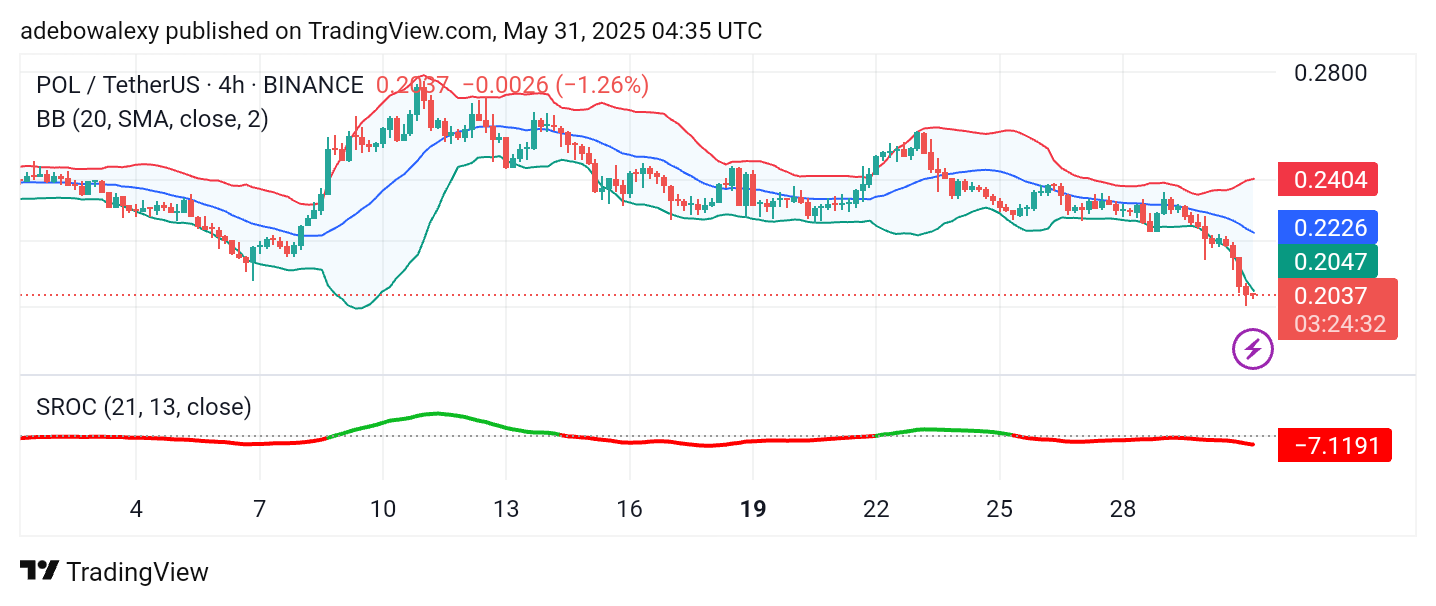
This candle also remains below the lower band of the Bollinger Bands indicator, suggesting a persistent bearish sentiment. Additionally, the SROC indicator line continues to trend below the equilibrium level, maintaining a bearish trajectory. Therefore, it appears the market may fall toward the $0.1750 price level.