Solana (SOL) Price Prediction: SOL/USDT Sees a Bearish Correction
Estimated Reading Time: 2 minutes
Don’t invest unless you’re prepared to lose all the money you invest. This is a high-risk investment and you are unlikely to be protected if something goes wrong. Take 2 minutes to learn more

Date: May 30, 2025
As usual, the Solana market has continued to demonstrate a moderate degree of correlation with the Bitcoin market. Price action in the Solana market recently breached the $170 threshold to approach the $180 resistance level. However, as BTC dived, it has also triggered a pullback here.
SOL/USDT Long-Term Trend: Bullish (Daily Chart)
Key Price Levels:
Resistance: $170, $180, $200
Support: $160, $150, $140
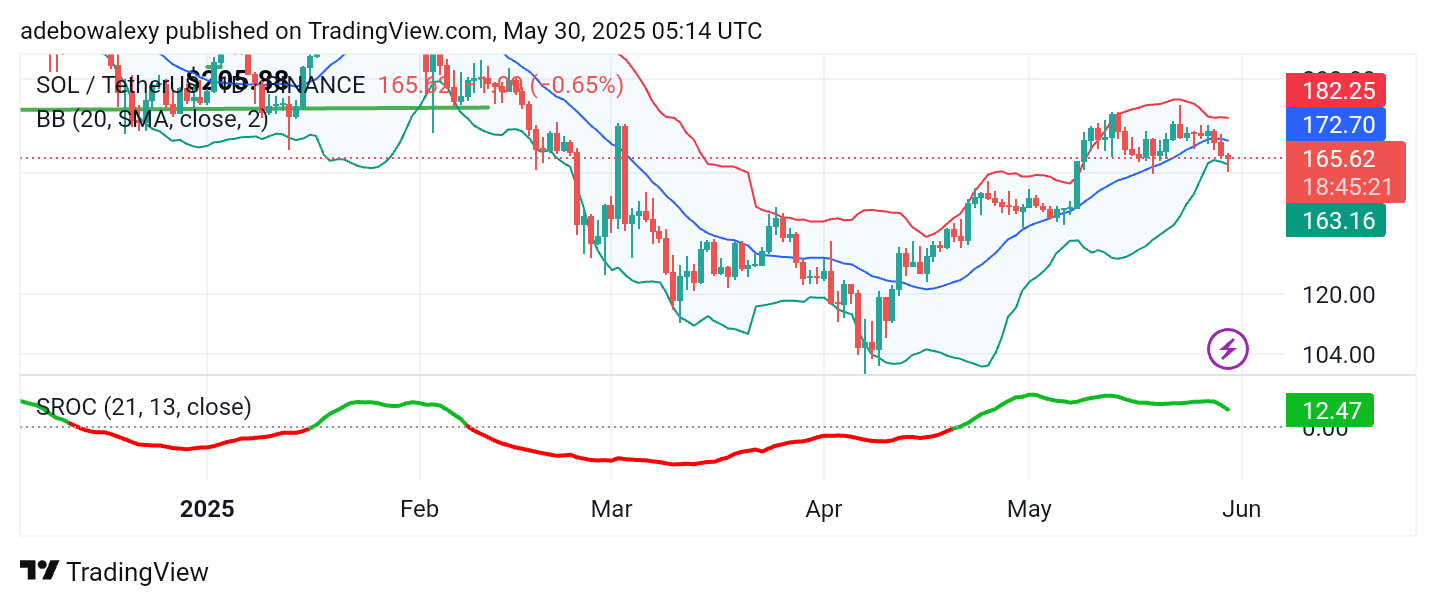
Price activity in the Solana market has undergone a sharp downward retracement. The most recent price candle on the chart has tested the lower limit of the Bollinger Bands. As a result, the candle appears to be contracting after touching this lower boundary. Meanwhile, the Smoothed Rate of Change (SROC) indicator remains above the equilibrium level. However, the terminal end of this indicator line is sloping downward, suggesting a weakening bullish momentum.
Solana (SOL) Price Prediction: SOL/USDT May Refocus on Higher Targets
The most recent price candle in the Solana market is red but has contracted significantly, resembling a hammer-shaped candle. This suggests that buying pressure may be returning.
The SROC indicator line is still above the equilibrium level, although the terminal end of the line is sloping downward. Nevertheless, the fact that price action remains above the equilibrium level indicates that a recovery toward higher price regions remains feasible.
Solana (SOL) Price Prediction: SOL/USDT Posts a Minimal Upward Rebound
The Solana market, as shown on the 4-hour chart, indicates that price action may have started an upward pullback. However, at this point, price action remains below the middle Bollinger Band and hovers near the lower limit of the Bollinger indicator.
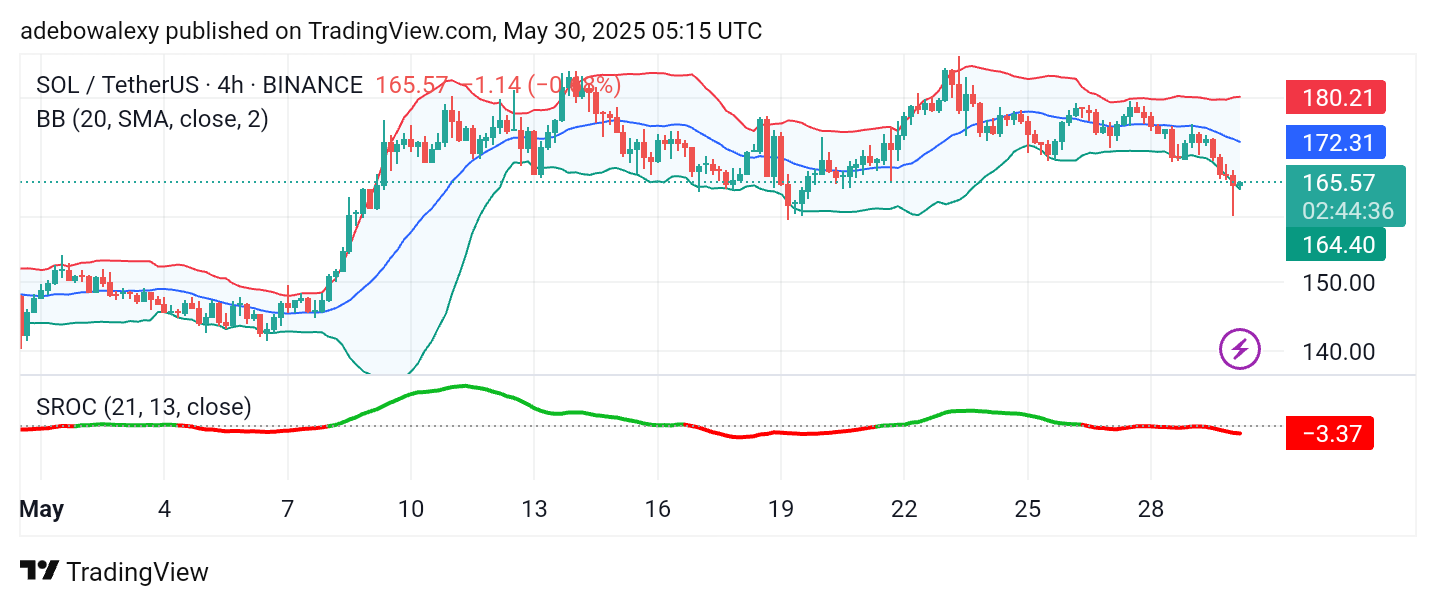
Meanwhile, the SROC indicator line has fallen below the equilibrium level. That said, the line now appears to be moving sideways, which supports the idea that bullish forces are attempting to regain strength. This could support a continued rebound, with the market potentially aiming first for the $180 level.