Chainlink Trends Sideways as Buyers Aim to Overcome the $16.58 Barrier
Estimated Reading Time: 2 minutes
Don’t invest unless you’re prepared to lose all the money you invest. This is a high-risk investment and you are unlikely to be protected if something goes wrong. Take 2 minutes to learn more
Chainlink (LINK) Long-Term Analysis: Bullish
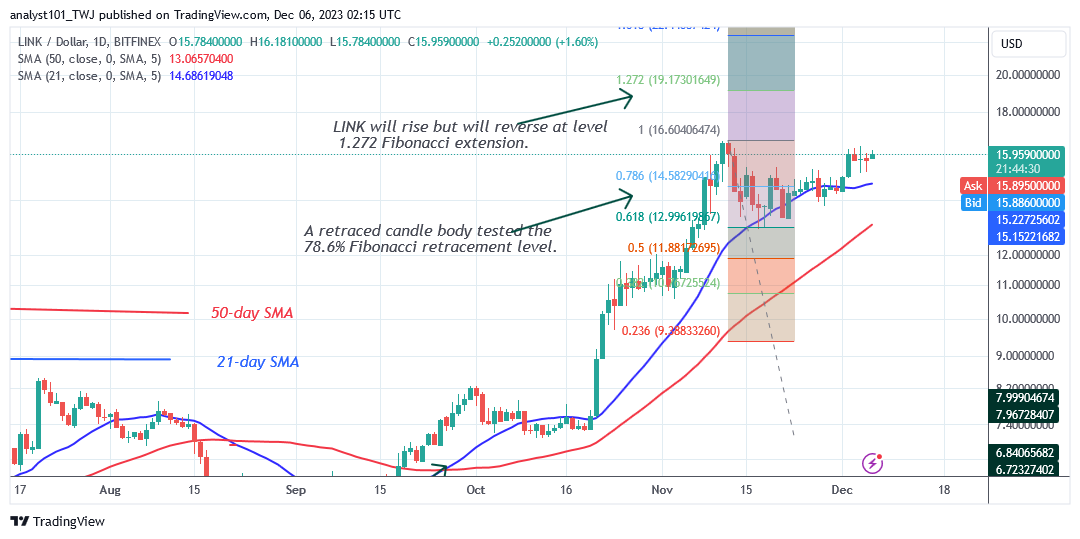
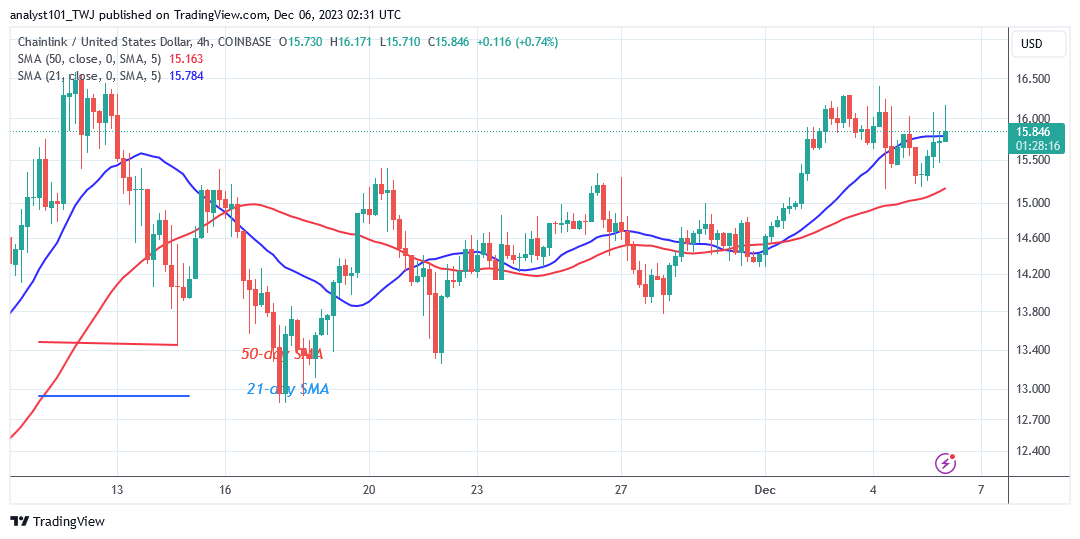
Chainlink (LINK) has been stuck at the recent high as buyers aim to overcome the $16.58 barrier. The inability of buyers to sustain the price above the recent high resulted in a sideways trend above the moving average lines. Buyers are currently driving the cryptocurrency’s price back up to the resistance level. At the time of writing, the price of LINK had reached a high of $15.86.
The latest high is providing resistance to the upward movement. If buyers succeed, however, the altcoin will reach a high of $19. The sideways trend will persist above the moving average lines if buyers are unable to break above the resistance level at $16.58. Nonetheless, if the 21-day SMA is breached and the negative momentum continues, the altcoin will fall.
LINK/USD will fall above the 50-day simple moving average or the $13 low.
Technical indicators:
Major Resistance Levels – $8.00, $10.00, $12.00
Major Support Levels – $6.00, $4.00, $2.00
Chainlink (LINK) Indicator Analysis
The price bars are above the moving average lines even though the uptrend has halted. The sideways trend has continued as buyers defend the price above the 21-day simple moving average support. If sellers breach the 21-day SMA support, the drop will begin.
What Is the Next Direction for Chainlink (LINK)?
The cryptocurrency is trending sideways above its moving average lines as buyers aim to overcome the $16.58 barrier. Buyers are working hard to break through the resistance level of $16.58. Chainlink is now experiencing an overbought condition in the cryptocurrency. If sellers appear in the overbought region, the coin will fall.
You can purchase crypto coins here. Buy LBLOCK
Note: Cryptosignals.org is not a financial advisor. Do your research before investing your funds in any financial asset or presented product or event. We are not responsible for your investing result