Ripple (XRP) Consolidates Near $1.10 Resistance, a Breakout Likely
Estimated Reading Time: 2 minutes
Don’t invest unless you’re prepared to lose all the money you invest. This is a high-risk investment and you are unlikely to be protected if something goes wrong. Take 2 minutes to learn more

Ripple (XRP) Long-Term Analysis: Bullish
On May 23, Ripple (XRP) fell to $0.65 low as the bulls bought the dips. The altcoin rebounded above the current support and resumed its uptrend. Buyers pushed the crypto to the high of $1.10 resistance zone on May 26. The bulls could not sustain the bullish momentum above the resistance level. This has compelled the crypto to resume a sideways move between $1.02 and $1.10. Ripple will rally to $1.30 high if the bulls break the resistance at $1.10. Nonetheless, if the bullish momentum is sustained, XRP will rise above $1.40.This will catapult XRP to be out of downward correction. Besides, the upside momentum will resume.
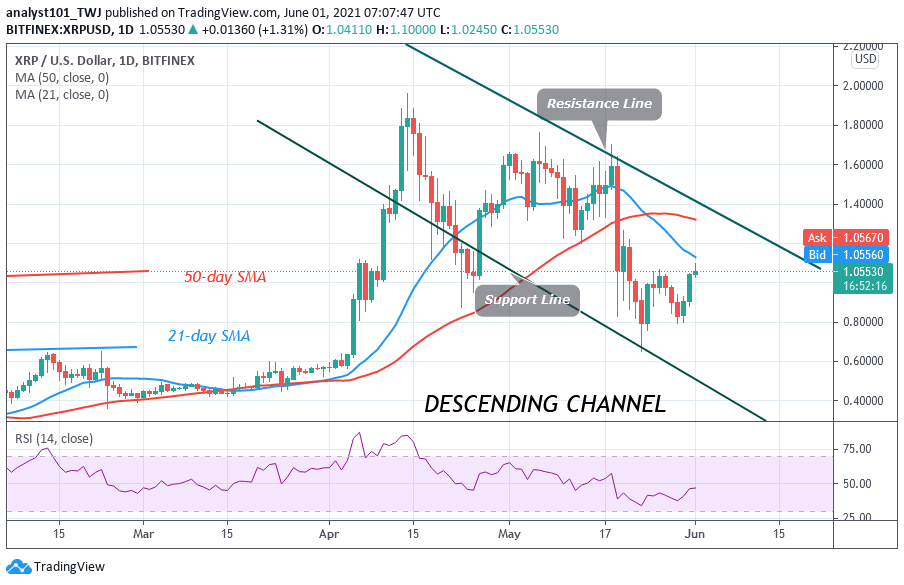
Ripple (XRP) Indicator Analysis
Ripple is below the 80% range of the daily stochastic. It indicates that XRP price is in a bearish momentum. The coin is falling and may find support above the SMAs.The crypto is at level 40 of the Relative Strength Index period 14. It indicates that the market is in the downtrend zone and below the centerline 50. The altcoin is capable of falling on the downside in a downtrend zone.

Technical indicators:
Major Resistance Levels – $2.00, $2.50, $3.00
Major Support Levels – $1.50, $1.00, $0.50
What Is the Next Direction for Ripple (XRP)?
Ripple is consolidating near the resistance at $1.10 for a possible upward move. It is confirmed that consolidation near the resistance zone, increases the chances of a breakout. Meanwhile, on May 25 uptrend; a retraced candle body tested the 61.8% Fibonacci retracement level. The retracement indicates that Ripple is likely to rise to level 1.618 Fibonacci extension or level $1.30.

Note: new.cryptosignals.org is not a financial advisor. Do your research before investing your funds in any financial asset or presented product or event. We are not responsible for your investing results