Polygon (POL) Price Prediction: POL/USDT Rises Through the $0.4000 Threshold
Estimated Reading Time: 3 minutes
Don’t invest unless you’re prepared to lose all the money you invest. This is a high-risk investment and you are unlikely to be protected if something goes wrong. Take 2 minutes to learn more

Polygon (POL) Price Prediction: September 14
For an extended period, the Polygon market has been making lower lows, resulting in a slow-paced or steady downtrend. Price activity picked up minimal upward momentum over the past seven sessions, leading to price action breaking through the resistance formed by the downward-sloping price channel.
POL/USDT Long-term Trend: Bullish (Daily Chart)
Key Price Levels:
Resistance: $0.4500, $0.5000, $0.5500
Support: $0.4000, $0.3500, $0.3000
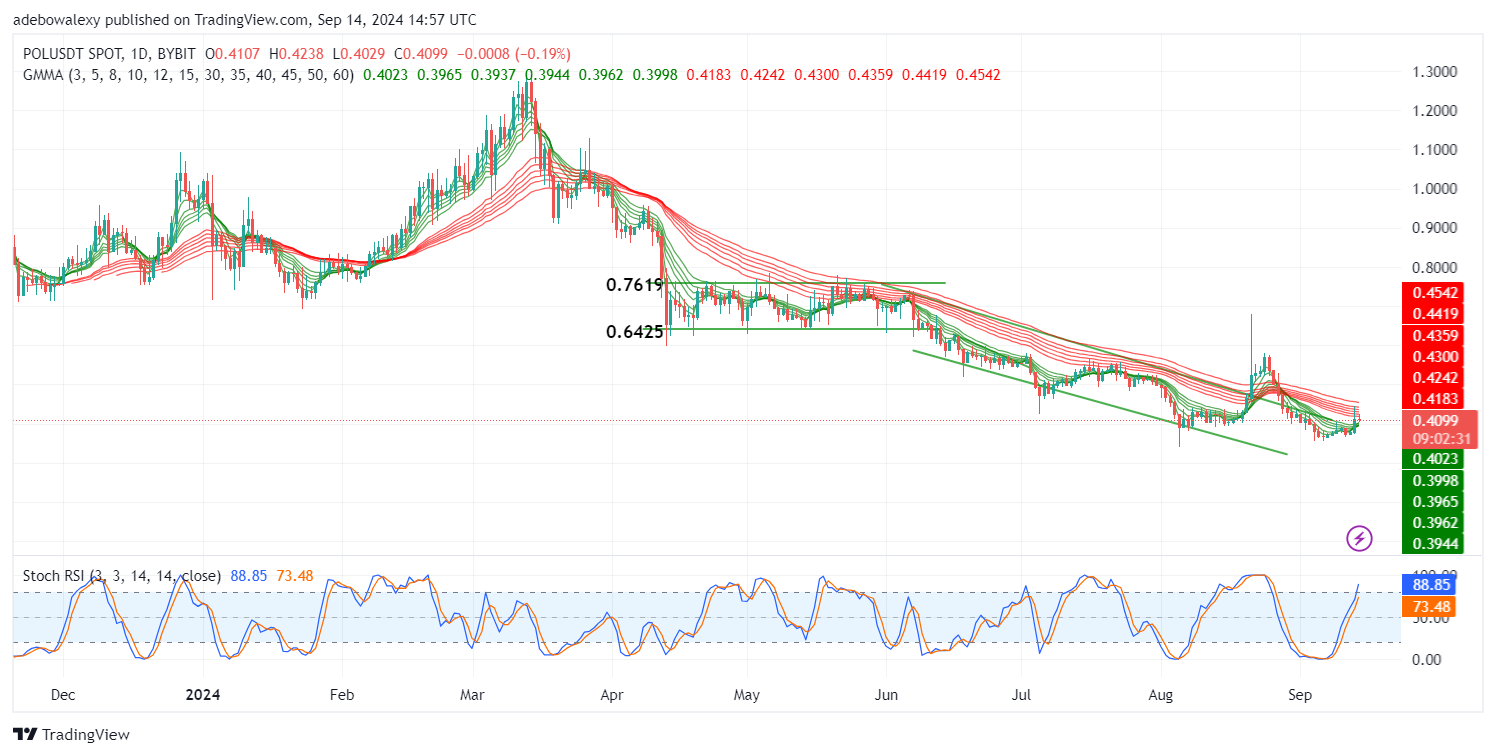
Currently, the POL/USDT market is trading above the downward-sloping price channel. The ongoing session is represented by a red price candle, but it trades above the green set of Guppy Multiple Moving Average (GMMA) lines. Meanwhile, the Stochastic Relative Strength Index (Stochastic RSI) lines continue to rise into the overbought region without hinting at a shift in the market’s trend.
Polygon (POL) Price Prediction: POL/USDT May Extend the Upside Retracement
Price action in the Polygon 24-hour market, in general, seems to be performing fairly well. The appearance of the last price candle on the chart between the two sets of GMMA lines suggests that price action has secured some upside ground, positioning the market well for trend continuation.
Additionally, the Stochastic RSI lines are also rising into the overbought region, indicating that upside forces are having a notable influence on price movement. Therefore, traders can anticipate trend continuation through the red lines of the GMMA indicator. However, such expectations warrant a more careful check on the trend’s viability, which is carried out below.
Polygon (POL) Price Prediction: POL/USDT Buyers Seem to Be Re-entering (4-Hour Chart)
The POL/USDT 4-hour market has previously risen through all the GMMA lines. Headwinds mounted forward pressure but failed to cause significant disruption. As a result, the ongoing session has appeared as a green price candle. Meanwhile, the Stochastic RSI lines are descending into the oversold region.
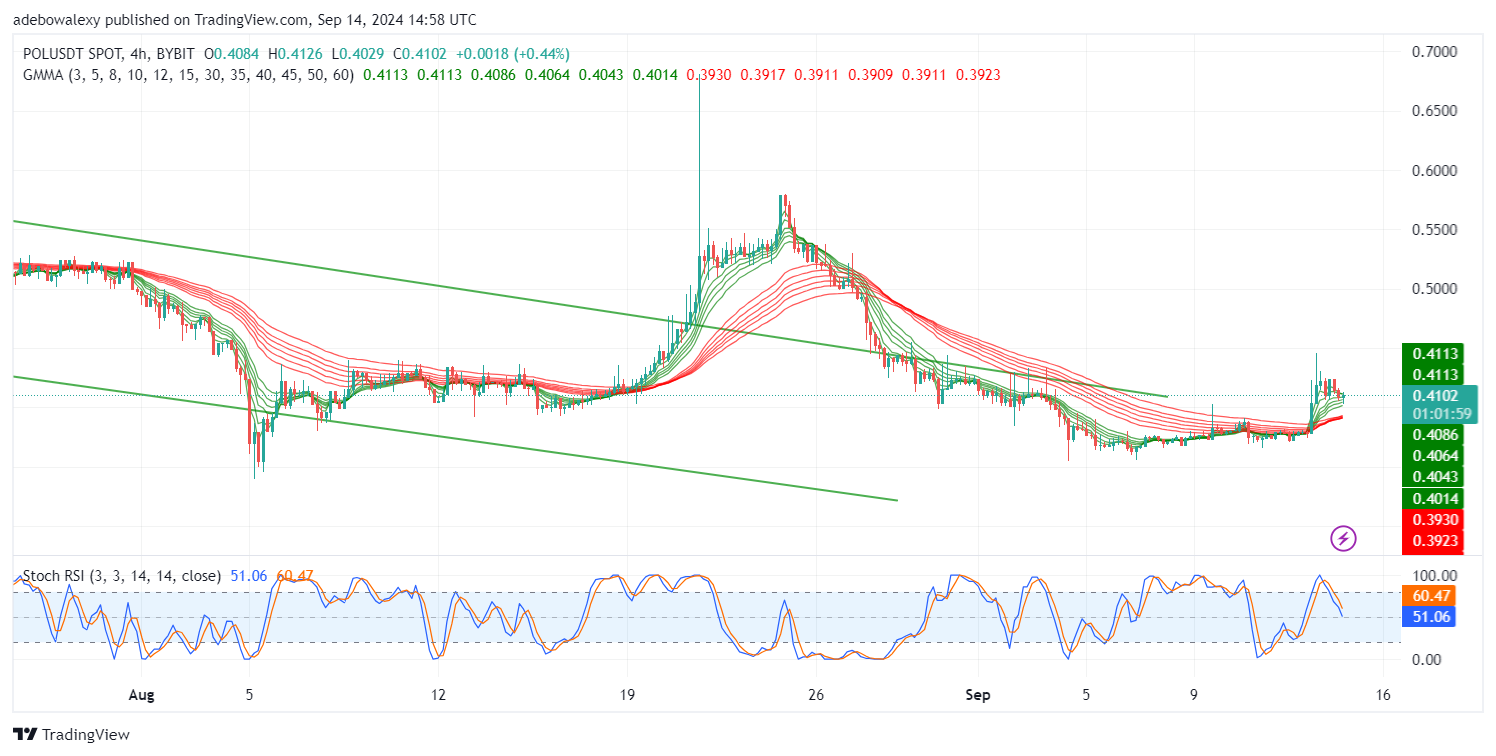
Nevertheless, judging by the position of the last price candle, it appears that upside forces are taking effect. Also, the position of the price candle above most of the GMMA lines provides a solid baseline for more traders to anticipate an upside continuation. Consequently, the market likely extends toward the $0.4500 threshold.