Lucky Block Price Prediction: LBLOCK/USD Targets $0.000035 Resistance
Don’t invest unless you’re prepared to lose all the money you invest. This is a high-risk investment and you are unlikely to be protected if something goes wrong. Take 2 minutes to learn more
Lucky Block Price Prediction – December 6
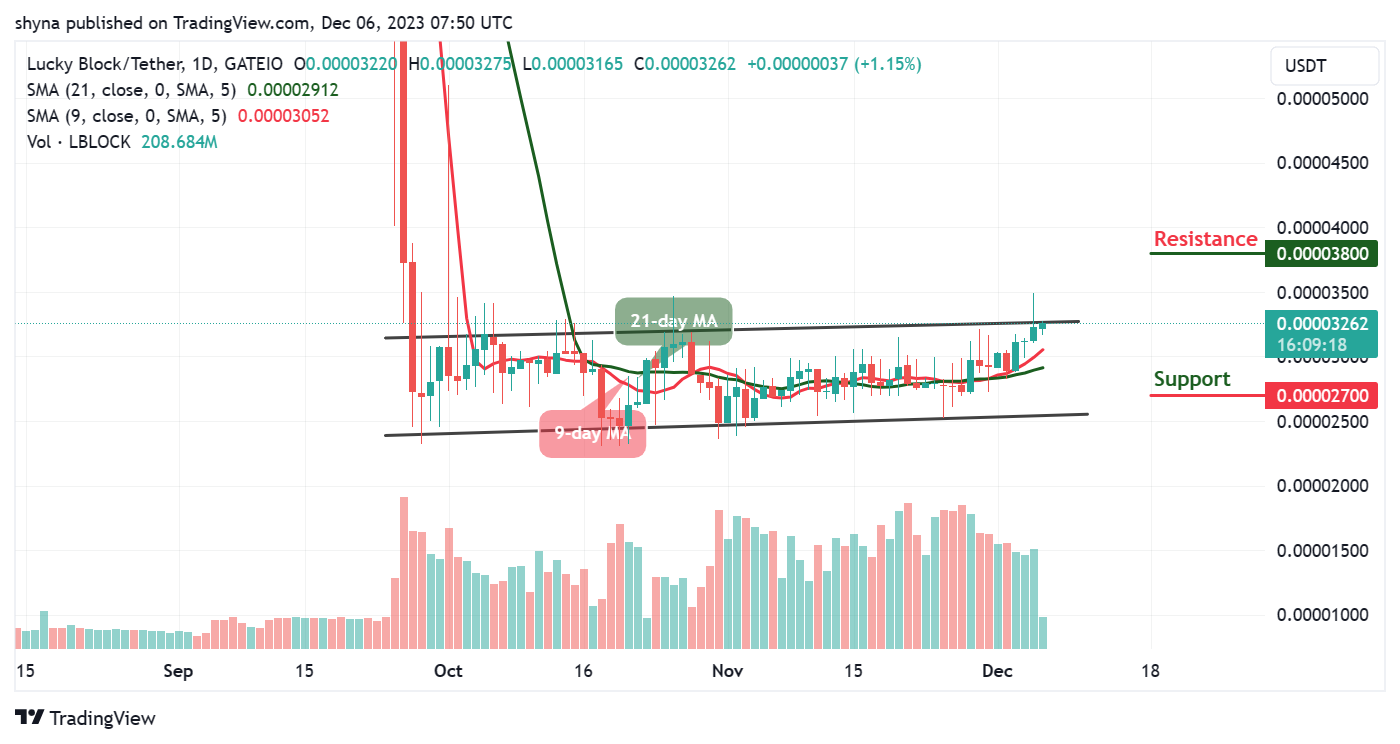
The Lucky Block price prediction is moving to cross above $0.000033 as the buying pressure increases within the market.
LBLOCK/USD Long-term Trend: Ranging (1D Chart)
Key Levels:
Resistance levels: $0.000038, $0.000040, $0.000042
Support levels: $0.000027, $0.000025, $0.000023

LBLOCK/USD will soon cross above the resistance level of $0.000035 as the coin prepares for a cross above the upper boundary of the channel. Meanwhile, the current trend suggests a bullish movement in the next positive direction as buyers should invest more in the coin.
Lucky Block Price Prediction: LBLOCK/USD Heads to the Upside
As of the current moment, the Lucky Block price is witnessing a surge in trading volume, accompanied by a bullish consolidation in a positive trajectory. However, a potential delay in the coin’s bullish momentum might expose new buyers to increased downward pressure for bears. However, possible support levels in such a scenario are anticipated at $0.000027, $0.000025, and $0.000023.
Nevertheless, a glance at the daily chart reveals a persistent bullish trend for the Lucky Block price, marked by the 9-day Moving Average consistently positioned above the 21-day Moving Average. Should bullish momentum intensify, potential resistance levels may emerge at $0.000038, $0.000040, and $0.000042.
LBLOCK/USD Medium-term Trend: Ranging (4H Chart)
The 4-hour chart indicates that the Lucky Block price is currently positioned above both the 9-day and 21-day moving averages. In the event of a sustained bullish trend, the coin is anticipated to breach the upper boundary of the channel. Conversely, a retracement leading toward the lower boundary of the channel could see the price potentially reaching the support level at $0.000029 and below.
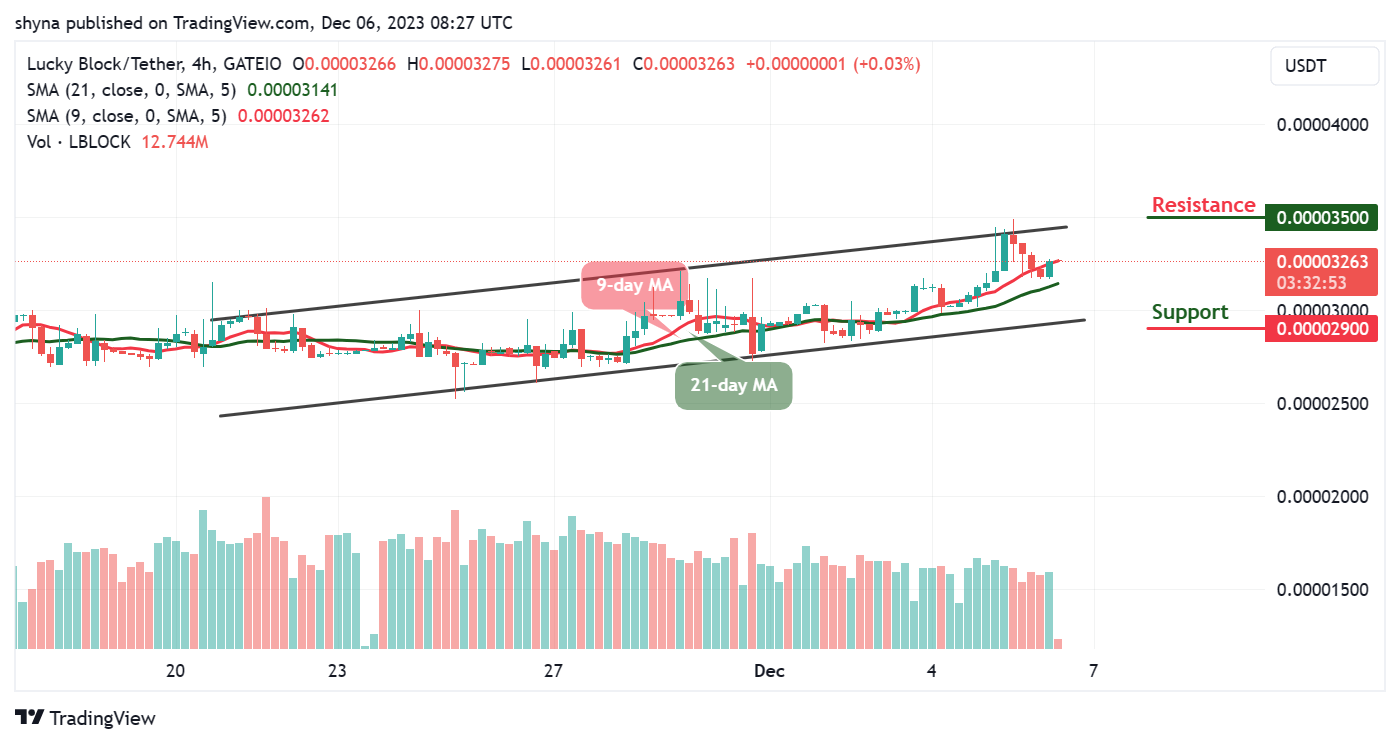
Furthermore, an escalation in buying pressure has the potential to propel LBLOCK/USD, causing it to surge and encounter resistance at $0.000035 and above. Notably, the 9-day moving average is exhibiting strength well above the 21-day moving average, signaling a favorable setup for an upcoming bullish market movement.
You can purchase Lucky Block here. Buy LBLOCK
